This is the multi-page printable view of this section. Click here to print.
Concepts
- 1: Curation of Transgene Expression in VFB
- 2: Split Driver Expression Patterns
- 3: NBLAST
- 4: Bridging Registrations
- 5: Cell Types
- 6: Confidence Values
- 7: FlyLight Adult CNS Imaging Tiles
1 - Curation of Transgene Expression in VFB
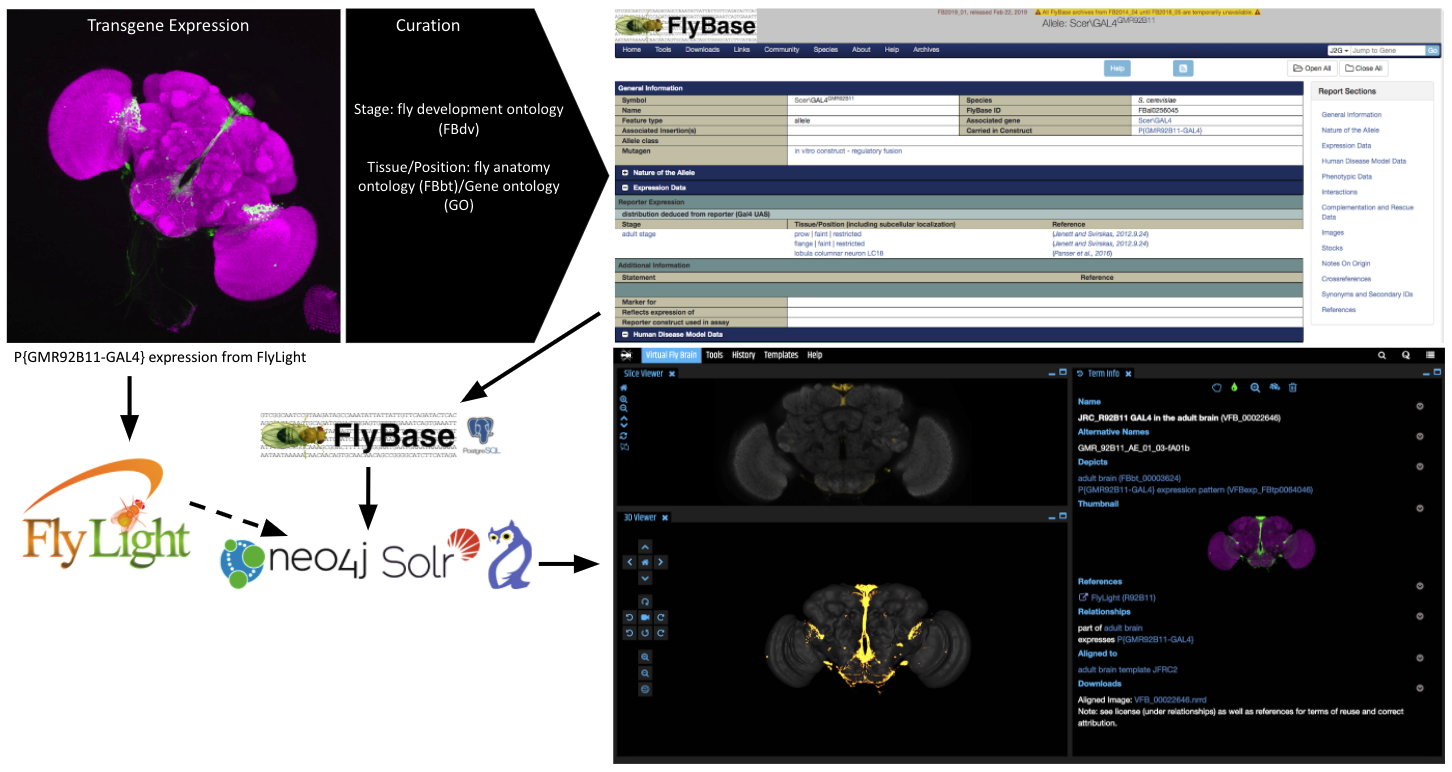
Virtual Fly Brain (VFB) and FlyBase curators record information from the literature about the expression of single transgenes using ontology terms and load this into FlyBase. VFB combines curated expression, genetic and publication data from FlyBase with 3D images of the expression patterns aligned to standard templates. These annotated images can then be searched and queried via the web interface or APIs.
2 - Split Driver Expression Patterns
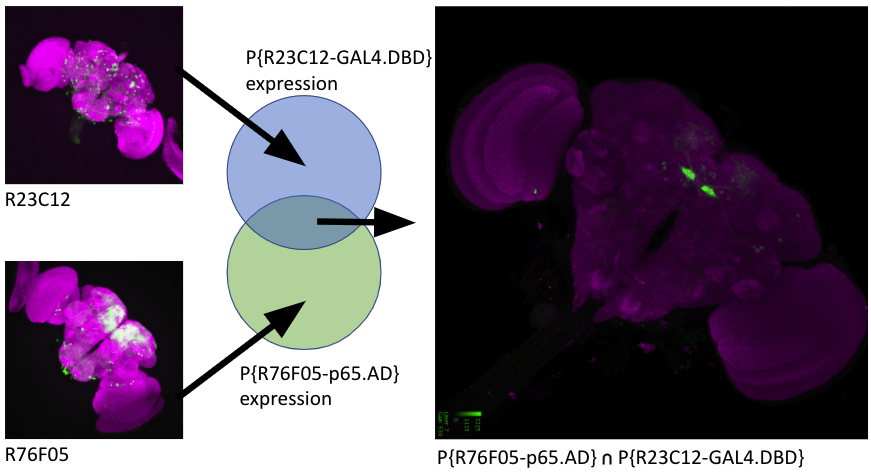
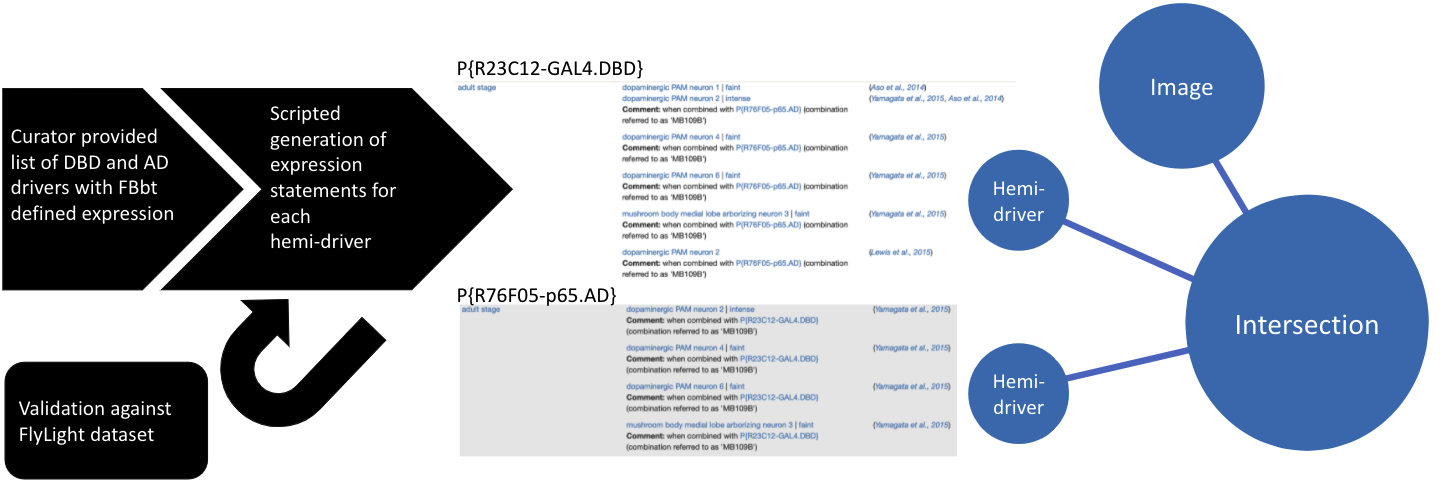
Split drivers comprise at least two partial transcription factors that can reconstitute an active transcription factor when expressed in the same cell. By using different regulatory regions for each component, functional driver expression can be restricted to the intersection of the expression patterns of these regulatory regions. A wide range of regulatory regions have been combined with transcription factor DNA binding domains (DBDs) and Activation Domains (ADs) to form thousands of distinct constructs, referred to as hemidrivers. Millions of combinations are therefore possible, each targeting some precise subset of the many thousands of neurons in the Drosophila nervous system.
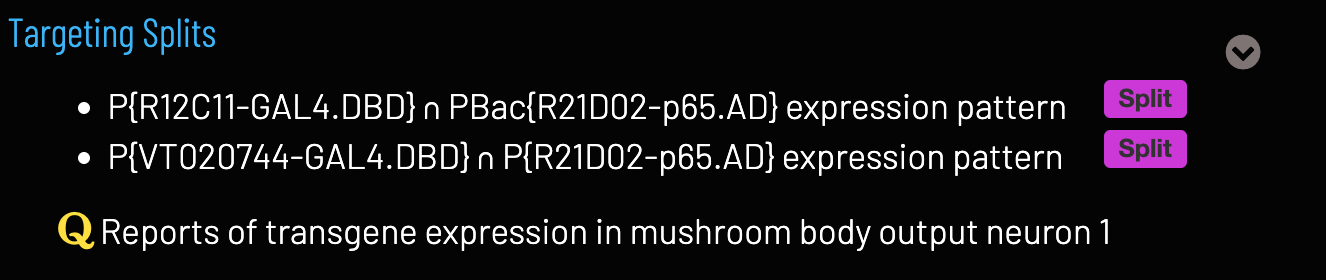
Researchers can identify split drivers for neurons of interest from the Targeting Splits section of a cell type Term Info page or by using similarity scores from a single neuron image. It is also possible to search directly for particular hemidrivers and combinations.
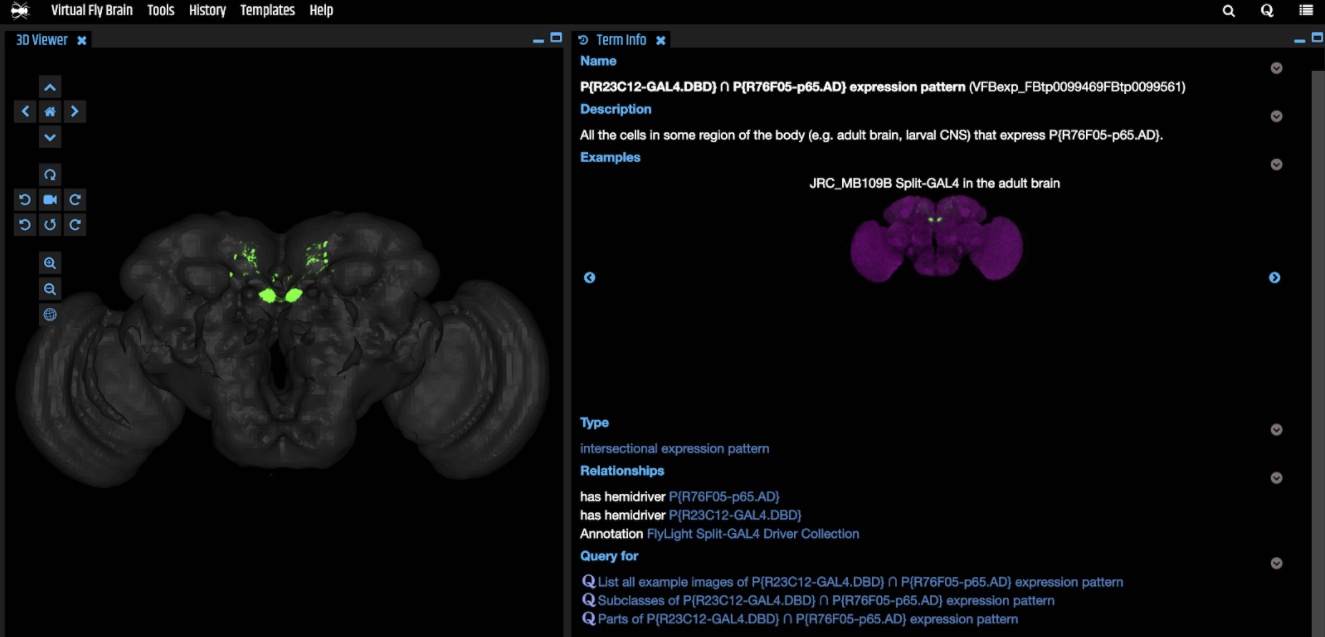
Similar to non-split drivers, VFB contains images and curated information about expression patterns for combinations. Each combination gets a standard name in VFB, reflecting the names of the component hemidrivers and any short names for the combination from the literature are added as synonyms (e.g. “P{VT017411-GAL4.DBD} ∩ P{VT019018-p65.AD} expression pattern” has_exact_synonym: SS02256").
VFB curation uses programmatic methods to generate expression statements for FlyLight hemidriver combinations. Combinations are validated against a local copy of the FlyLight dataset and loaded into FlyBase. VFB then links each expression pattern image and the curated expression information to an intersection of the two appropriate hemidrivers.
3 - NBLAST
What is NBLAST?
NBLAST (Costa et al., 2016) is a computational method to quantify morphological similarity between neurons. It provides an objective way to compare neuron shapes and identify morphologically similar cells within and across datasets.
How NBLAST works
NBLAST operates on “dotprops” - a representation of neurons as tangent vectors that capture the local geometry of neuronal arbors. The algorithm:
- Converts neurons to dotprops: Each neuron is represented as a set of points with associated directional vectors
- Compares vector pairs: For each tangent vector in a query neuron, NBLAST finds the closest tangent vector in the target neuron
- Calculates similarity scores: Scores are computed based on both the distance between vectors and their directional similarity (dot product)
- Normalizes results: Final scores are typically normalized to a self-self comparison, where a perfect match equals 1

NBLAST on VFB
VFB provides precomputed NBLAST scores for all neurons in its database, making morphological similarity searches fast and accessible without requiring computational expertise.
What’s included
VFB NBLAST scores cover:
-
All individual neurons from major connectome datasets including:
- FAFB-FlyWire
- Male-CNS optic lobe
- Hemibrain
- FlyCircuit
- FAFB-CATMAID datasets
-
Split-GAL4 expression patterns from FlyLight, enabling discovery of potential driver lines that label specific morphological types
Types of comparisons
- Neuron-to-neuron: Find morphologically similar neurons within or across datasets
- Neuron-to-expression pattern: Identify split-GAL4 lines that might label neurons similar to those in connectome datasets
Using NBLAST on VFB
Accessing NBLAST queries
See Similarity Score Queries Guide for details of how to find NBLAST similarity queries in the VFB interface.
Interpreting results
NBLAST scores range from -1 to 1:
- 1.0: Perfect match (identical morphology)
- 0.5-1.0: High similarity
- 0.0-0.5: Moderate similarity
- Below 0.0: Low similarity or dissimilar morphologies
Results are typically ranked by score, with the most similar items appearing first.
Applications
Research applications
- Cell type classification: Group neurons by morphological similarity
- Cross-dataset comparison: Find corresponding cell types across different connectomes
- Driver line selection: Identify genetic tools for targeting specific morphological types
- Evolutionary studies: Compare homologous neurons across species
Workflow integration
NBLAST results on VFB can be:
- Exported for further analysis
- Used to build custom neuron collections
- Combined with other search criteria (anatomy, connectivity)
- Accessed programmatically via VFB APIs
Technical considerations
Optimization for VFB
- All neurons are standardized to common template spaces
- Consistent spatial resolution across datasets
- Normalized scoring for cross-dataset comparisons
- Regular updates as new data becomes available
Limitations
- Focuses purely on morphological similarity
- May not capture functional relationships
- Sensitive to differences in reconstruction quality
- Template registration accuracy affects cross-dataset comparisons
Further reading
- NBLAST tutorial - Detailed programming tutorial
- Original NBLAST paper - Costa et al., 2016
- VFB NBLAST announcement - Recent updates and expanded coverage
4 - Bridging Registrations
Many transforms to map between different Drosophila template brains are available.
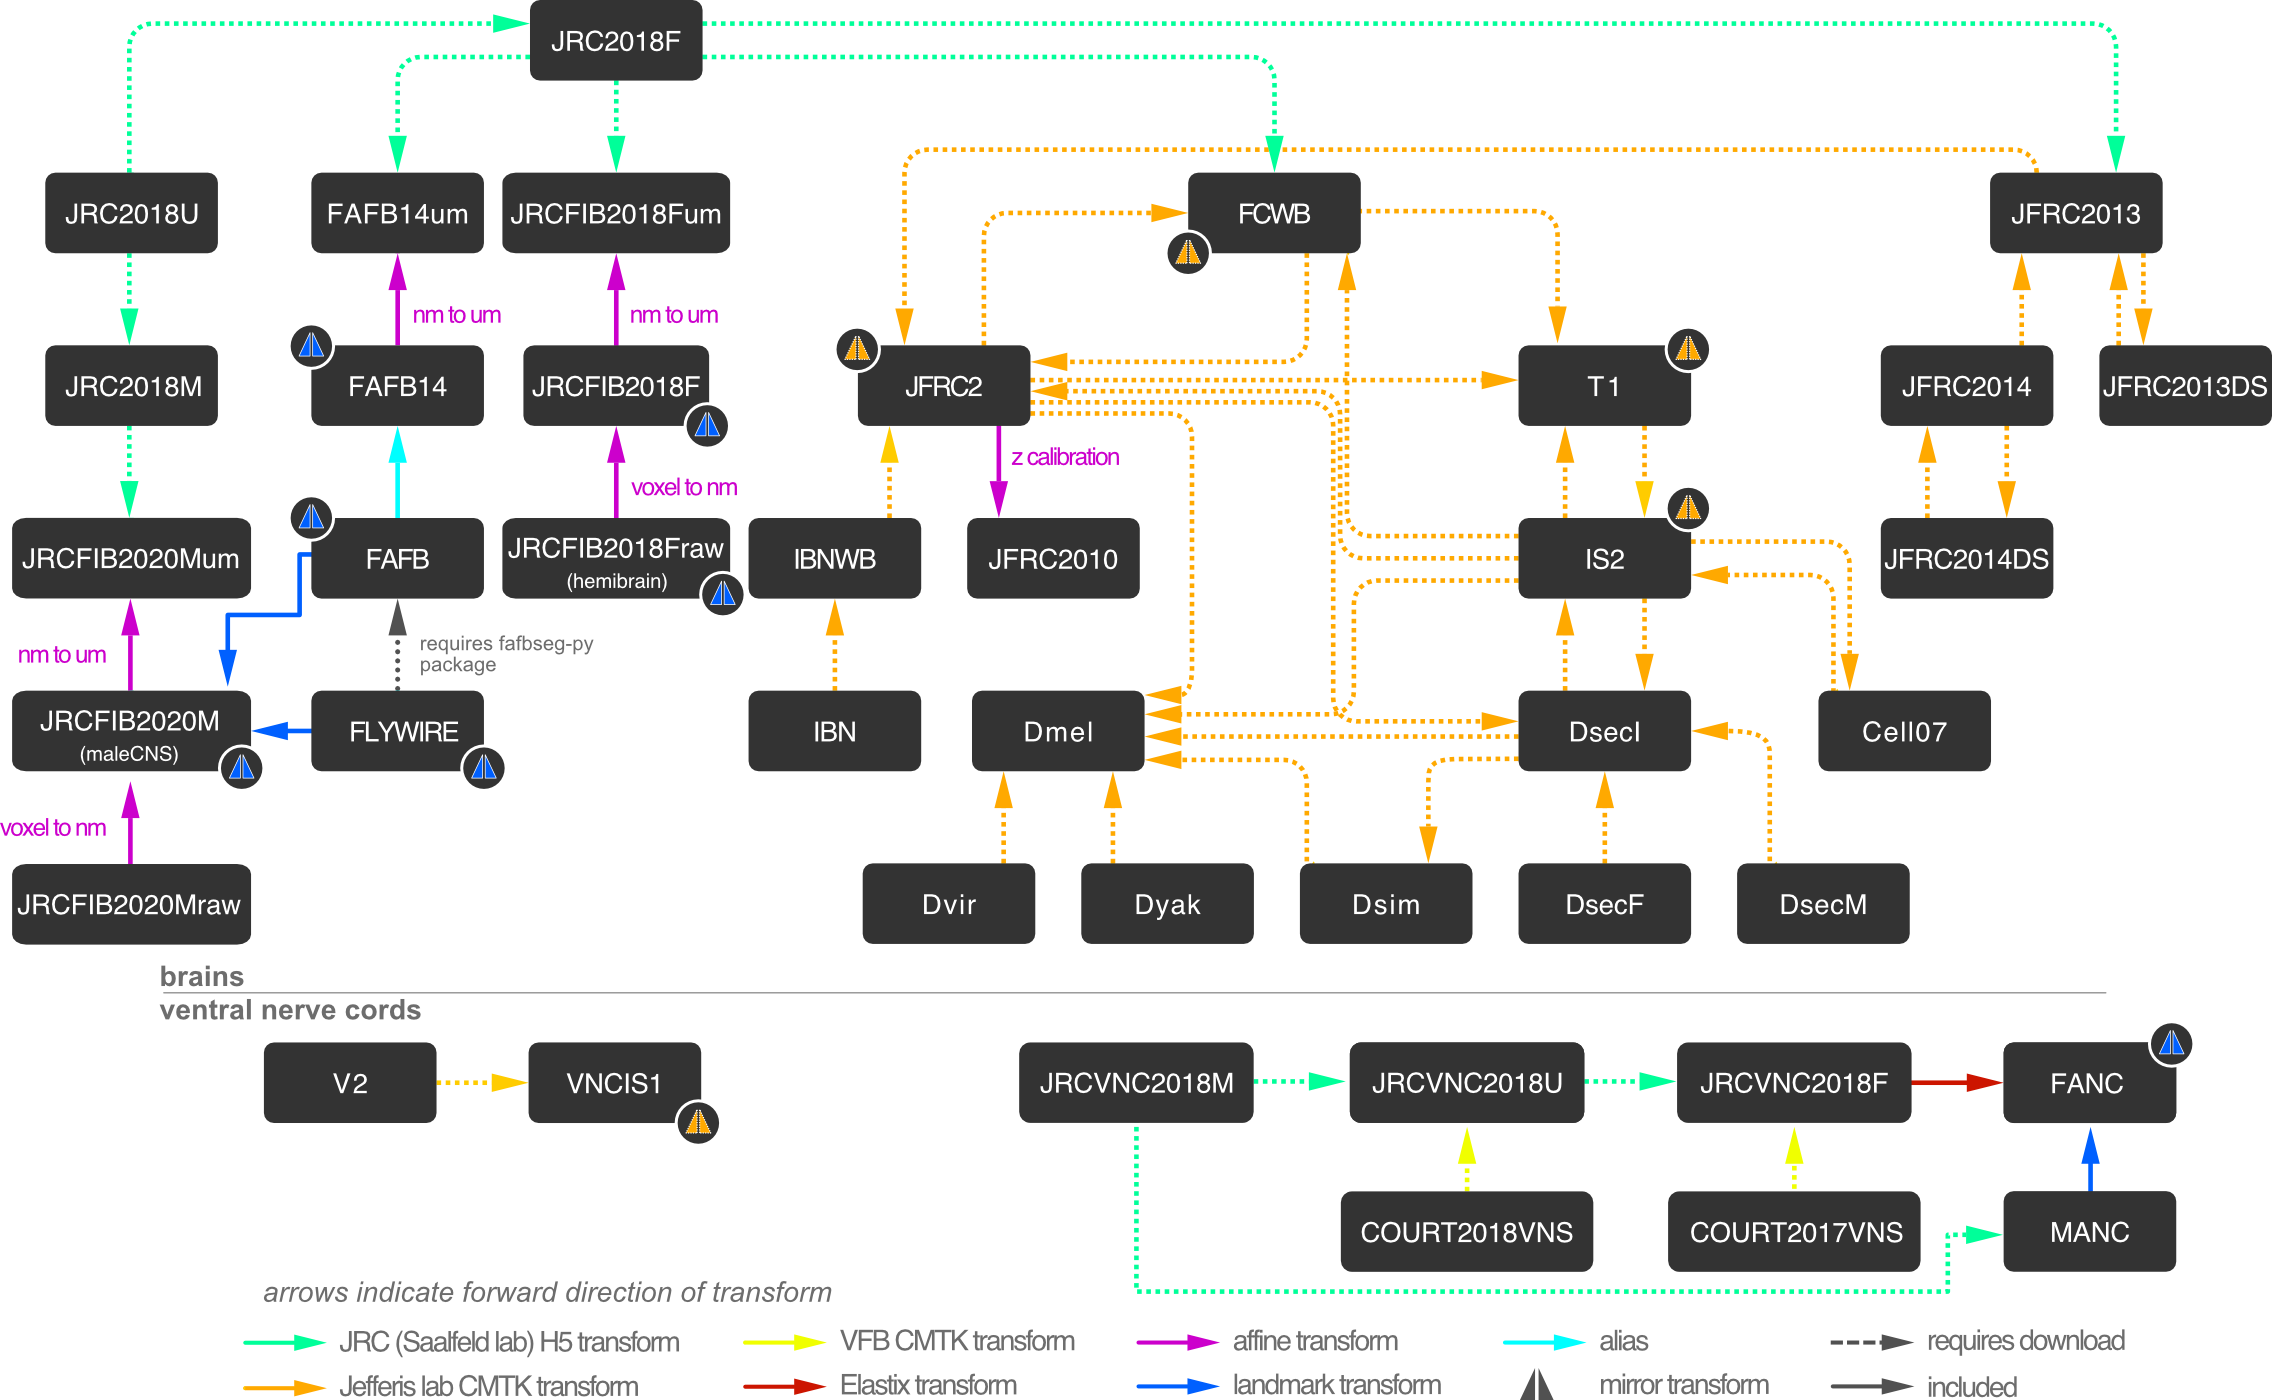
You can see how to use the above in python using navis-flybrains or in R using nat.flybrains
5 - Cell Types
Neurons on VFB are annotated with cell types from the Drosophila Anatomy Ontology (FBbt).
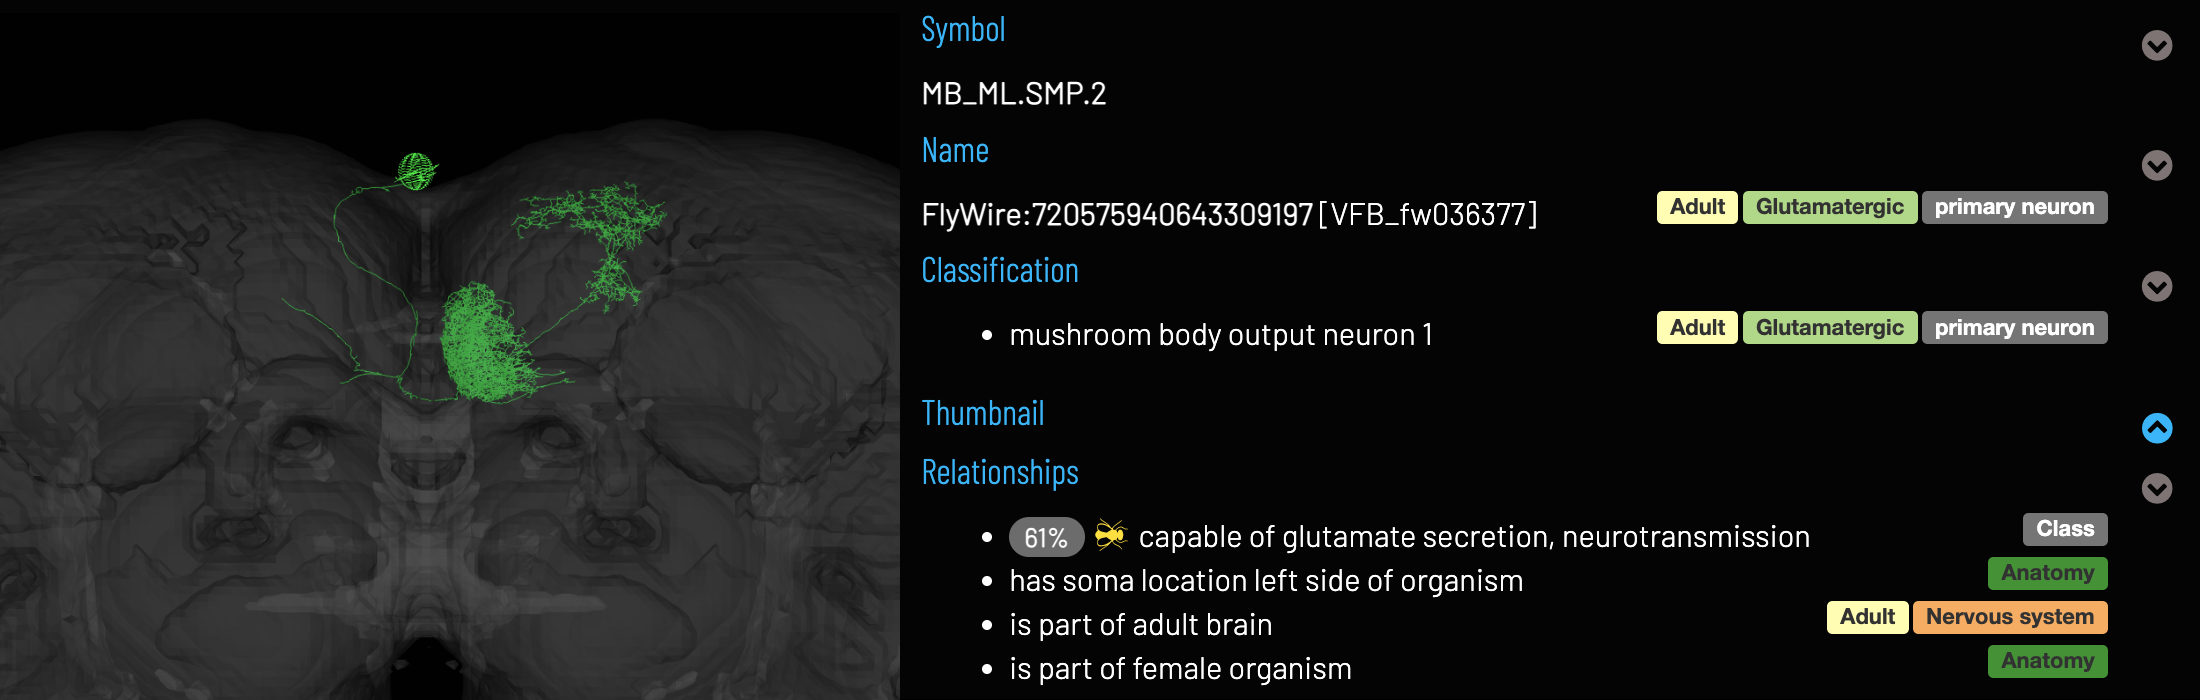
Why do we use ontology terms?
- Each term represents a concept of a cell type, with a definition based on referenced publications:
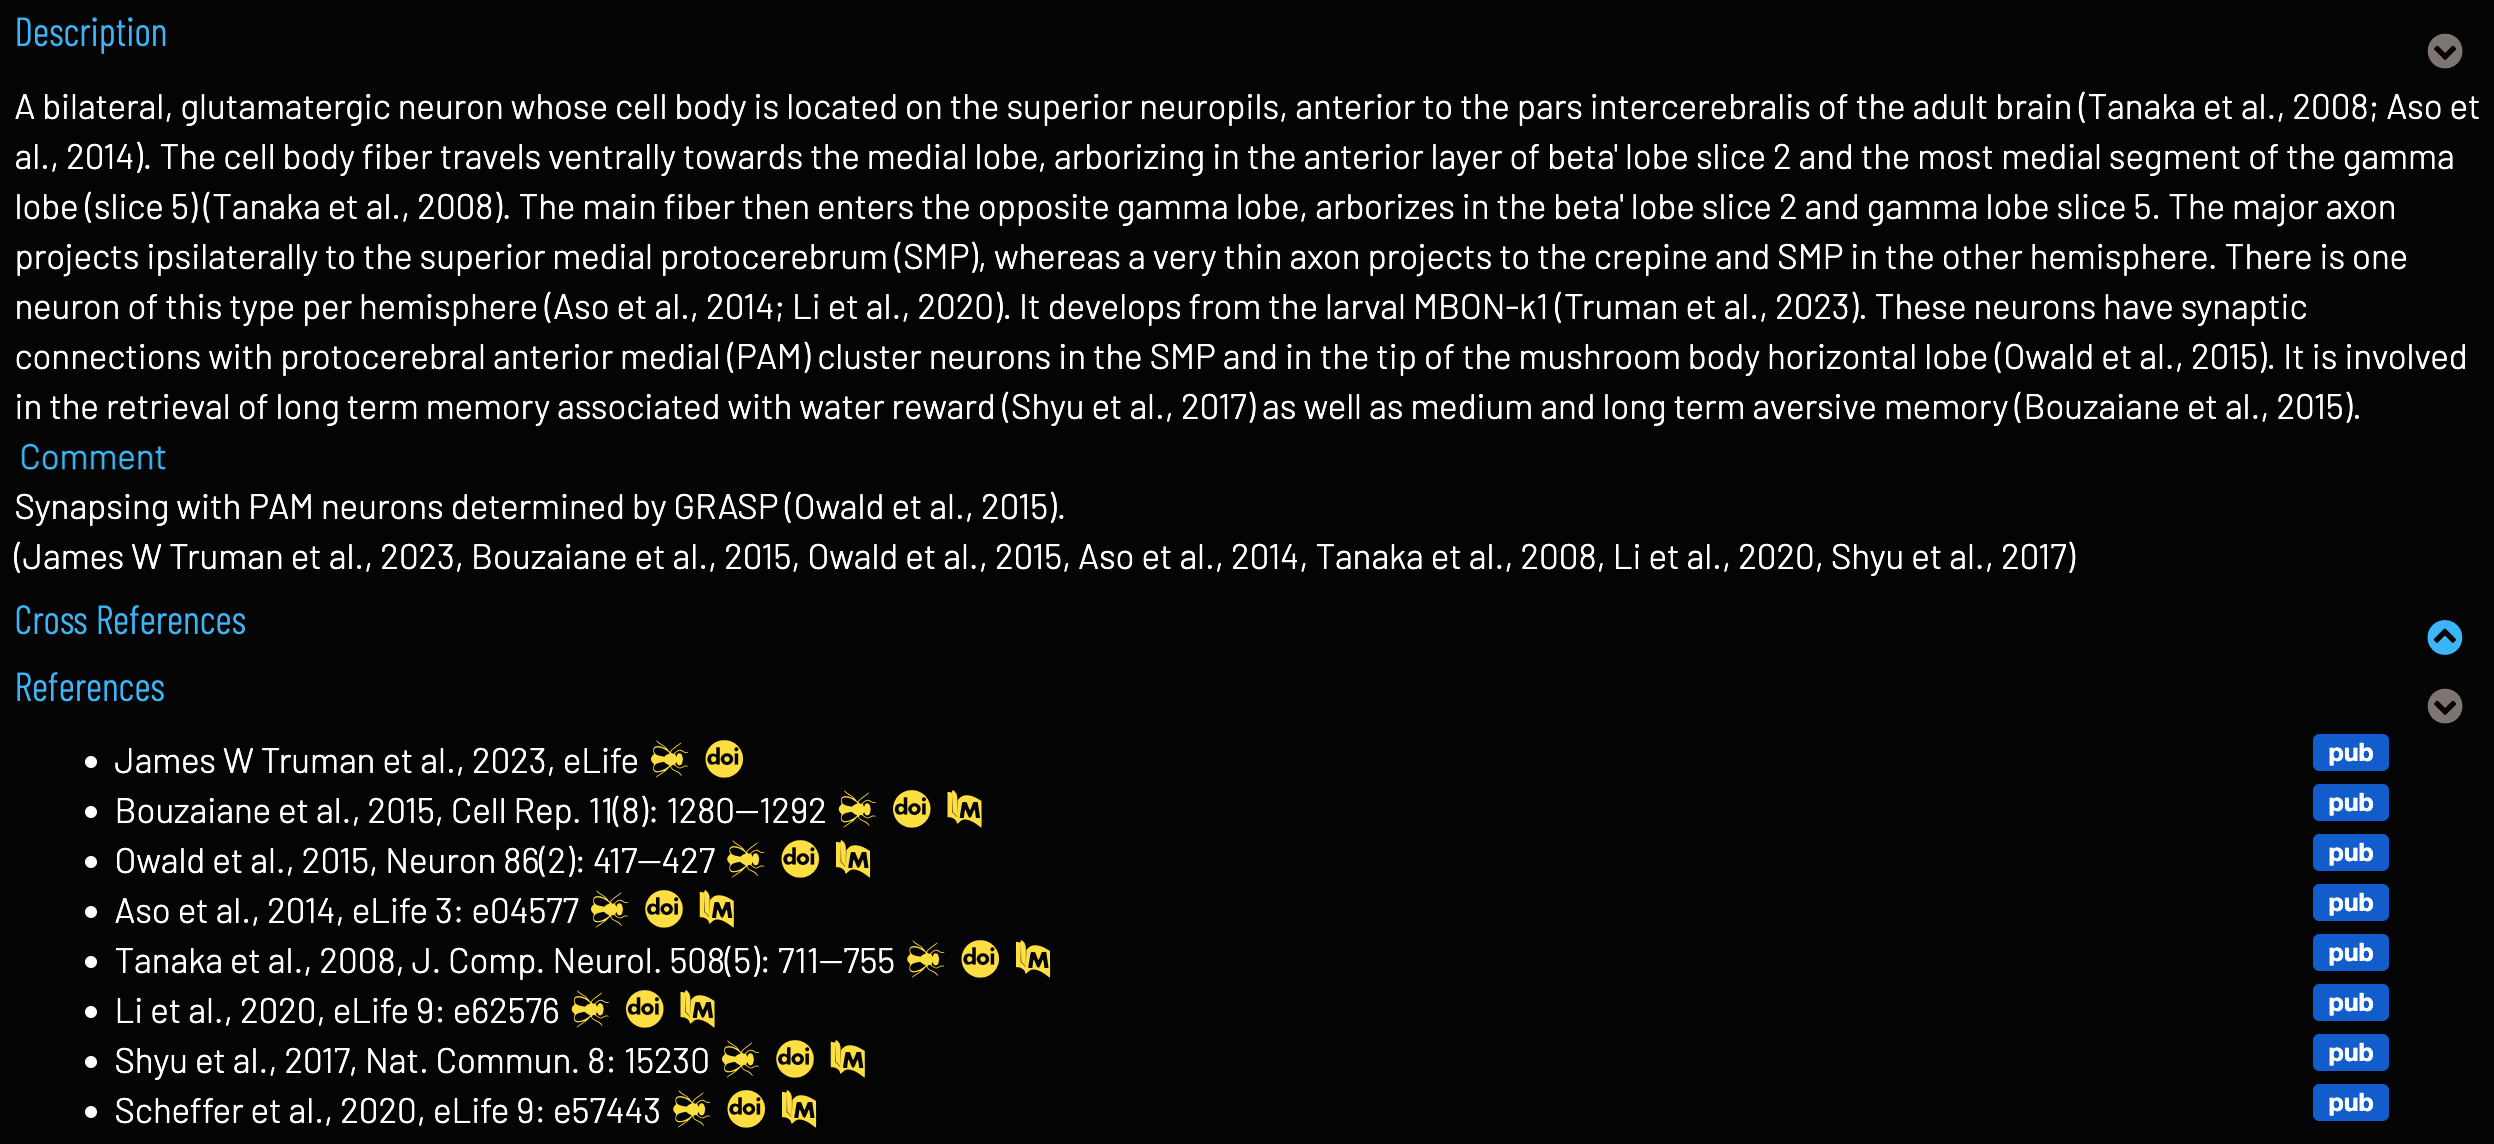
- As well as a label, each term has a collection of synonyms, facilitating identification even when the same type has been referred to by different names in different sources:
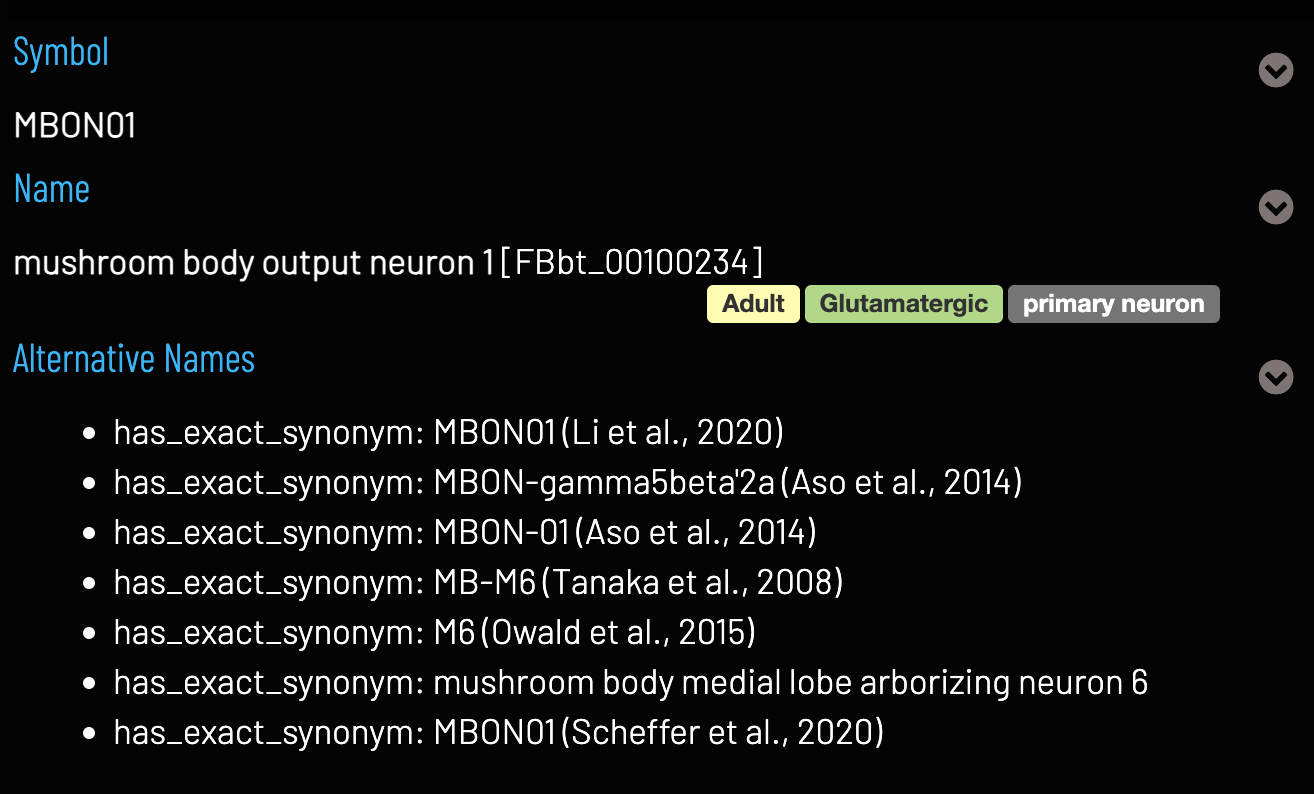
- Hierarchical – e.g. specific terms for MBON01, MBON02 etc., but also grouped by a general MBON term and all under ‘adult neuron’
- Neurons of the same type in multiple datasets can be linked to the same ontology term
- Persistent, resolvable identifiers to uniquely identify cell types e.g. http://virtualflybrain.org/reports/FBbt_00100234
We also use terms from the Drosophila Anatomy Ontology to annotate CNS regions (for the Template ROI Browser tool and neuron connectivity per region query) and other anatomical features.
6 - Confidence Values
Some annotations on VFB are based on predictions, for example, predicted neurotransmitters for neurons in electron microscopy datasets (see below). Where available, we include the confidence of these predictions (as a badge next to the annotation), as well as a link to the publication - in the example below, this would be by clicking on the ‘DOI’ badge.

Neurotransmitter Prediction Confidence Values
For MANC, optic-lobe and male-cns datasets, predictions are sourced from the neuprint predictedNt field, with data generated by Takemura et al. (2023), Nern et al. (2025) and Berg (2025), respectively. Predictions for FlyWire FAFB and Hemibrain datasets are conf_nt from Eckstein et al. (2024). BANC predictions are sourced from the Predicted NT type field of the Codex neurons.csv download and only used if not in conflict with the Verified NT type field, with data generated by Bates (2026).
In all cases, analysis was restricted to a particular set of neurotransmitters and assumed a single neurotransmitter per neuron (see publications for further detail). Neurons with fewer than 100 presynapses are excluded.
7 - FlyLight Adult CNS Imaging Tiles
While most first-generation FlyLight expression pattern images are single 20x objective acquisitions, many Split-GAL4 lines were imaged using 63x or 40x objectives. This requires multiple image acquisitions to cover the CNS regions of interest. VFB integrates only the combined images derived from these tiles and lists the tiles used to create these combined images in the comment section for each image, for example: “tile(s): ’left_dorsal, right_dorsal, ventral”. These tiles do not necessarily cover the entire brain or VNC, which complicates the assessment of the specificity of these lines. VFB notes in the comment where the combined tiles do not provide full coverage. For further information refer to Figure 4 Supplemental File 1 from ‘A split-GAL4 driver line resource for Drosophila CNS cell types’ direct link. This is a preprint and may be updated.
Sets of tiles from FlyLight (Meissner et al., 2024):


