This is the multi-page printable view of this section. Click here to print.
Navigating the VFB Website
- 1: Search and Query Tools on VFB
- 2: The 3D Viewer tab
- 3: The Slice Viewer tab
- 4: The Term Info tab
- 5: VFB Image Thumbnails
- 6: The Term Context tab
- 7: The Circuit Browser tab
1 - Search and Query Tools on VFB
VFB integrates data curated from the literature with image data from many sources. Searches and queries can be used to explore this data.

Search for the item you’re interested in
Query for related terms and images
The Search Tool
The search system allows you to search for neurons and neuroanatomical structures using almost any name found in the literature. Positive and negative filters can be applied from the drop-down to restrict the results.

The Query Tool
The query system can identify neurons innervating any specified neuropil or fasciculating with any specified tract. It also allows queries for genes, transgenes and phenotypes expressed in any brain region or neuron.

Queries from Term Info
Some Term Info panes have pre-defined queries relevant to that term. For example, the Term Info pane for a brain region may have queries for neurons innervating that region and drivers expressing in that region.

Query Results
Query results give information for each result, including thumbnail images where available. Results can be filtered by typing in the top bar and sorted by clicking on column titles.

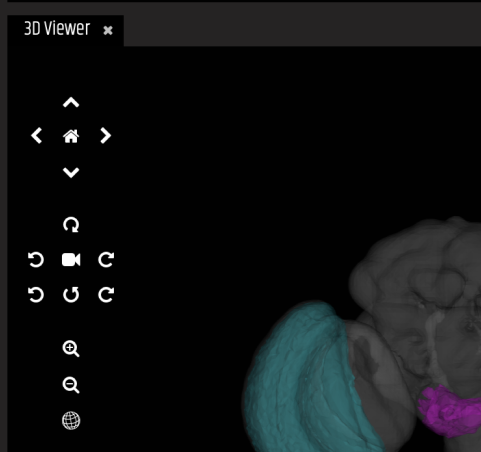
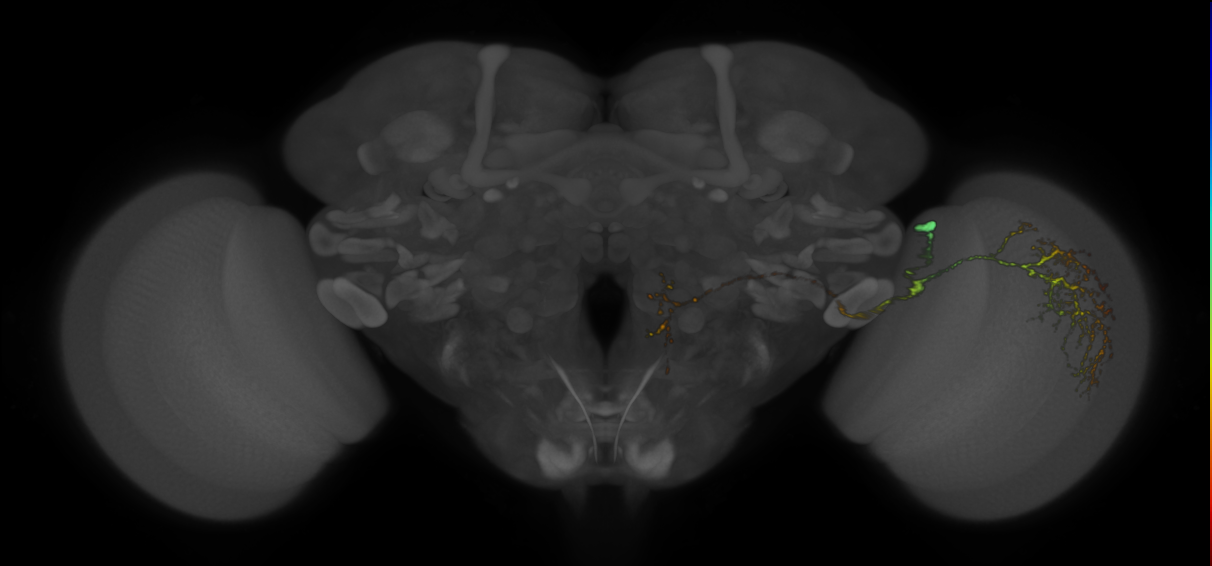
2 - The 3D Viewer tab
VFB features tens of thousands of 3D images of neurons, clones and expression patterns, registered to standard template brains. Any combination of these can be added to the 3D viewer together.
Point and click to select neurons/expression
Click and drag with the mouse or use the directional icons to rotate/move
Use the zoom icons or scroll with the mouse to zoom in/out
Home resets your view
The camera icon starts/stops a rotation animation of the scene
The sphere icon toggles wireframes on/off
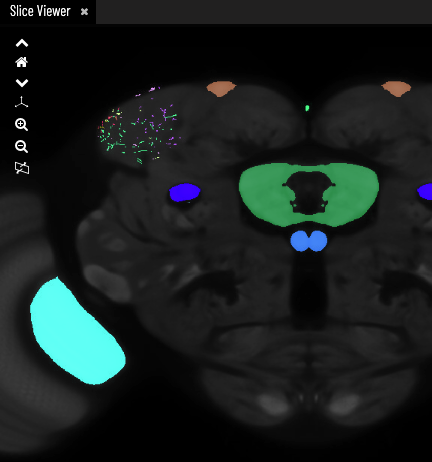
3 - The Slice Viewer tab
Hover to explore, click to list or shift + click to add painted anatomy
Use the arrow icons or scroll with the mouse to move through the stack
Home resets your view
Use the zoom icons or pinch gesture to zoom
Toggles through orthogonal views
Toggles the slice position on the 3D Viewer on/off
4 - The Term Info tab
Names
Each entity in VFB has a unique Name. The Name field also shows semantic tags, to provide additional at-a-glance information, and the identifier (e.g. FBbt_00003823) for the entity. Many entities also have a Symbol, which is a more compact name that has been used in the literature. Synonyms are shown in the Alternative Names field along with references, where available.

Ontology terms and Graphs
Classification and Relationships fields show parent and related ontology classes for the selected entity. Click to navigate to the Term Info pages for these terms. The location and classification Term Context graphs show partonomy relationships and parentage of the selected entity, respectively.

Click on terms to select them
Data
Thumbnails show available images (as a carousel if multiple). These can be clicked to add the image to the 3D viewer.
Click on thumbnails to add an image to the 3D viewer
Queries relevant to the selected entity can find related entities and other relevant information. Some EM neurons also have an option to add the neuron to the Circuit Browser tool to explore connectivity data. Queries are specialised for different types of entity, for example, the Term Info page for a neuronal cell type may have queries to find images, transgene expression and transcriptomics data, whereas an EM image may have queries to find connectivity data.
Run term related queries
Images (and citation information) can be downloaded from the Downloads section and their source dataset, template, and licence information can be found in their own Term Info fields.

Click on download items to begin downloading
References and Linkouts
Linkouts to external sites with further information about the selected entity can be found in the Cross References section where appropriate. Literature references are in the References section, with links to the articles themselves and the FlyBase bibliography pages where available.

5 - VFB Image Thumbnails
Thumbnails are found in query results and on Term Info pages.
VFB Thumbnail features
- Each pixel in a VFB thumbnail corresponds to a specific depth in the image stack.
- The color bar on the right side of the image shows the range of colours corresponding to the full depth of the template, with blue being shallow and red being deep from the perspective of the viewer.
- Brighter or more intense colors indicate higher intensity values at that depth.
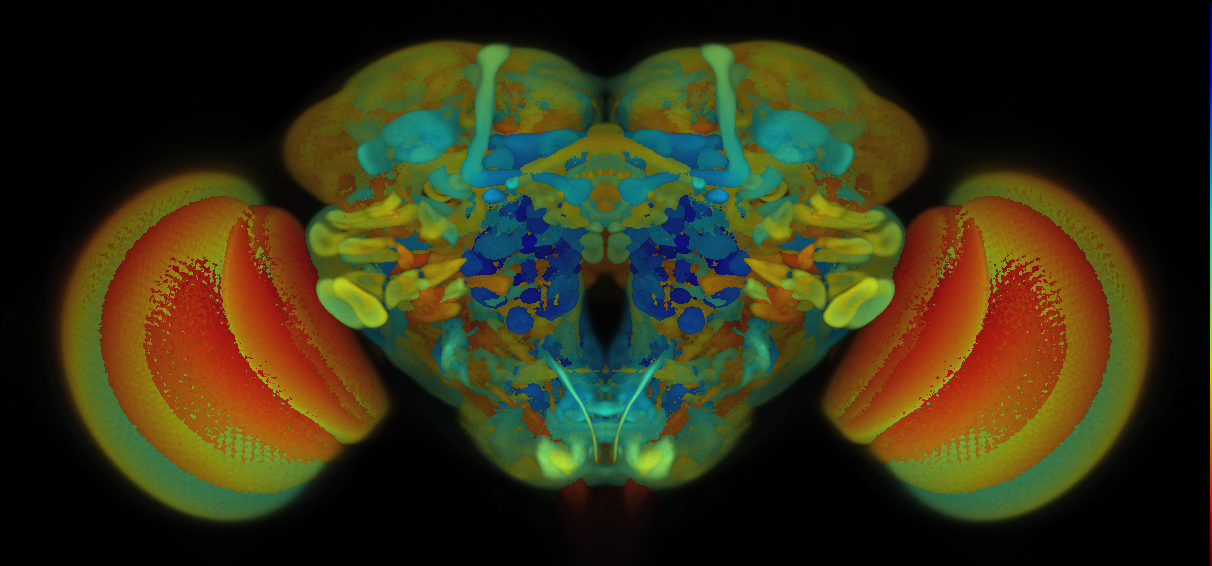
- This image uses nearly the whole of the available (Z) stack space, shown by the wide range of colour.
- This image uses much less of the available (Z) stack space, shown by the more restricted range of colour.
6 - The Term Context tab
Select a graph from the Term Info to display it in the Term Context pane. The location graph shows partonomy relationships, and the classification graph shows parentage of the selected term. Click on any term in the graph to select it and view its Term Info.

Home resets your view
Use the zoom icons or scroll with the mouse to zoom in/out
Click to refresh to the current focus term
Select either the location or the classification for the current term
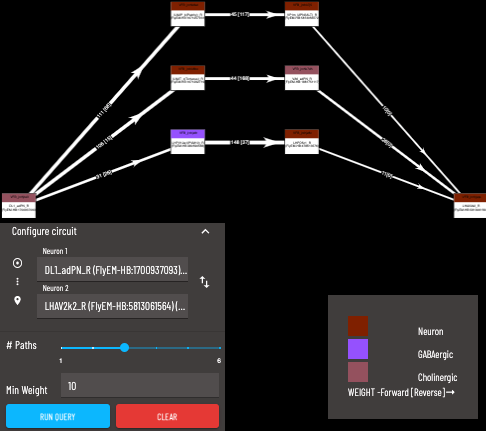
7 - The Circuit Browser tab
The ‘strongest’ paths are the shortest/highest weighted paths. Paths are arranged from the ‘strongest’ at the bottom to the ‘weakest’ at the top. A detailed explanation for the algorithm used to determine path strengths can be found here.
Search for the source neuron to start from (Note: query is directional)
Search for the target neuron
Maximum number of paths to return (only the ‘strongest’ paths will be returned)
A minimum weight for the synapse count of each connection can be applied, paths containing individual connections below this minimum will not be returned