Browsing single cell RNAseq data
How to navigate single cell RNAseq data on VFB.
Finding transcriptomics data on VFB
Finding cell type clusters
Cell types with available scRNAseq data can be identified using the ‘Has scRNAseq data filter’ when searching.
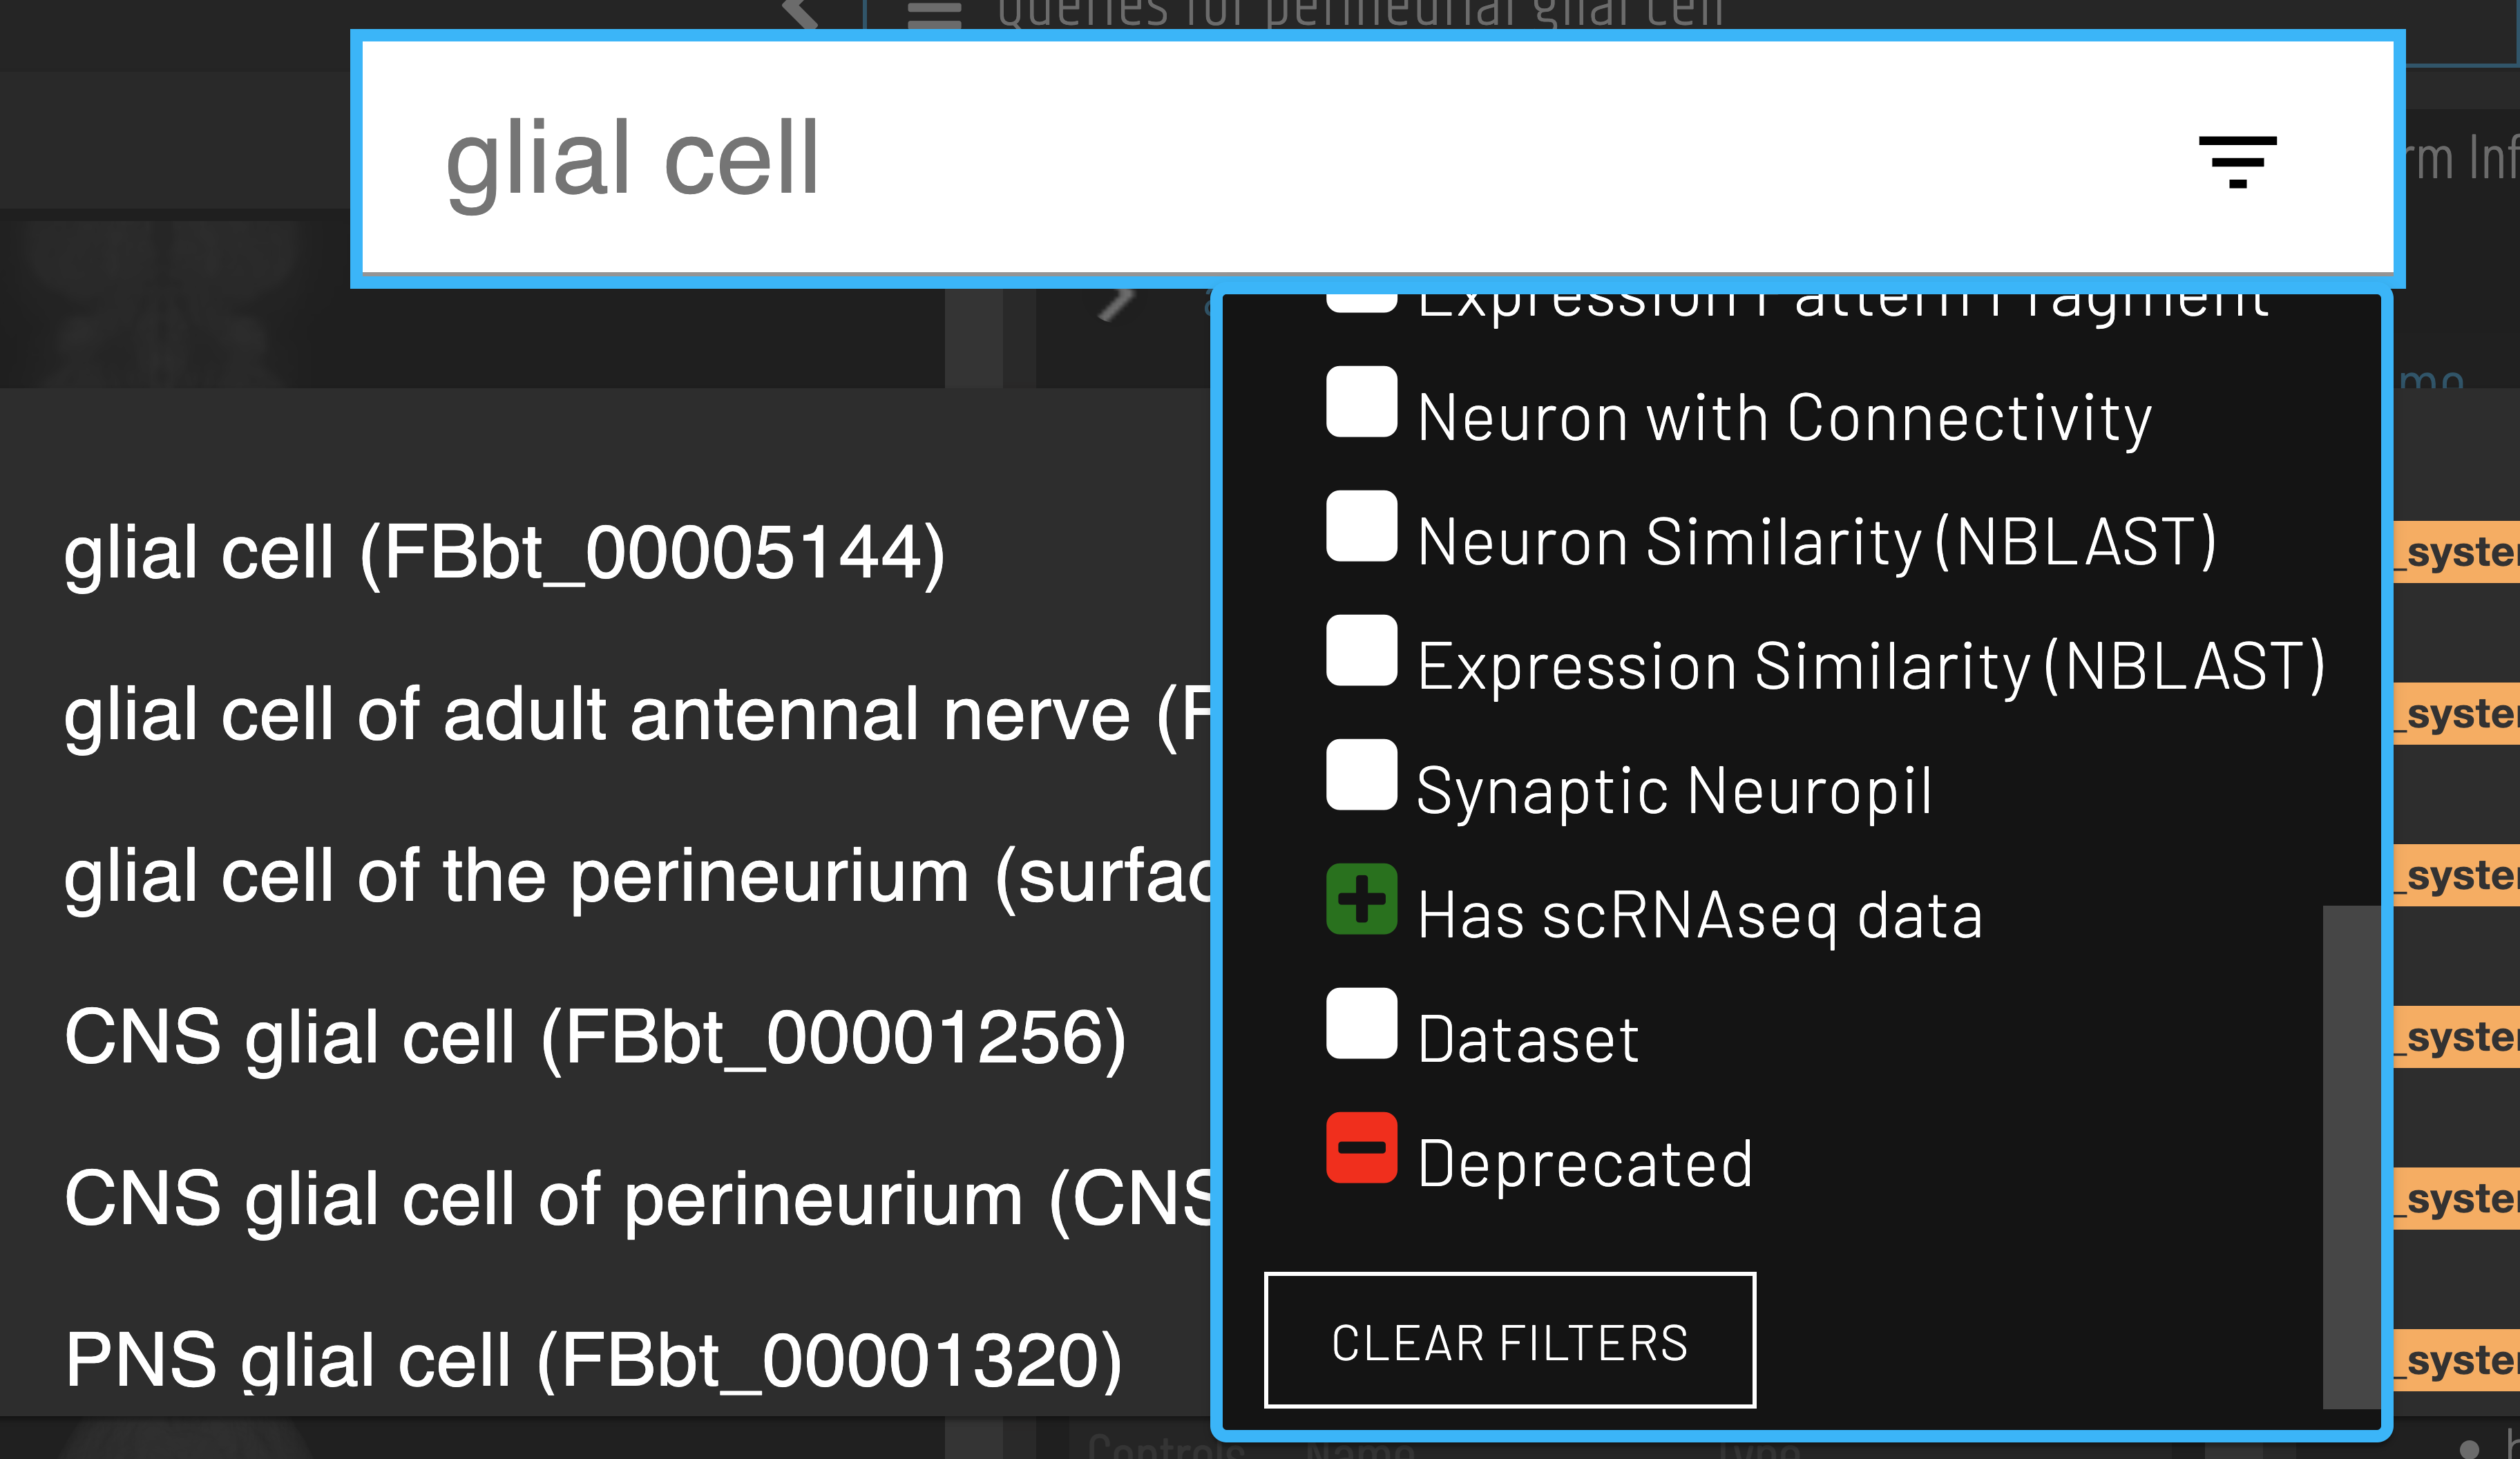
Clusters for a cell type of interest can be found via the ‘scRNAseq data for…’ query.

Gene expression data
After selecting a cluster, gene expression can be retrieved via the ‘Genes expressed in…’ query.
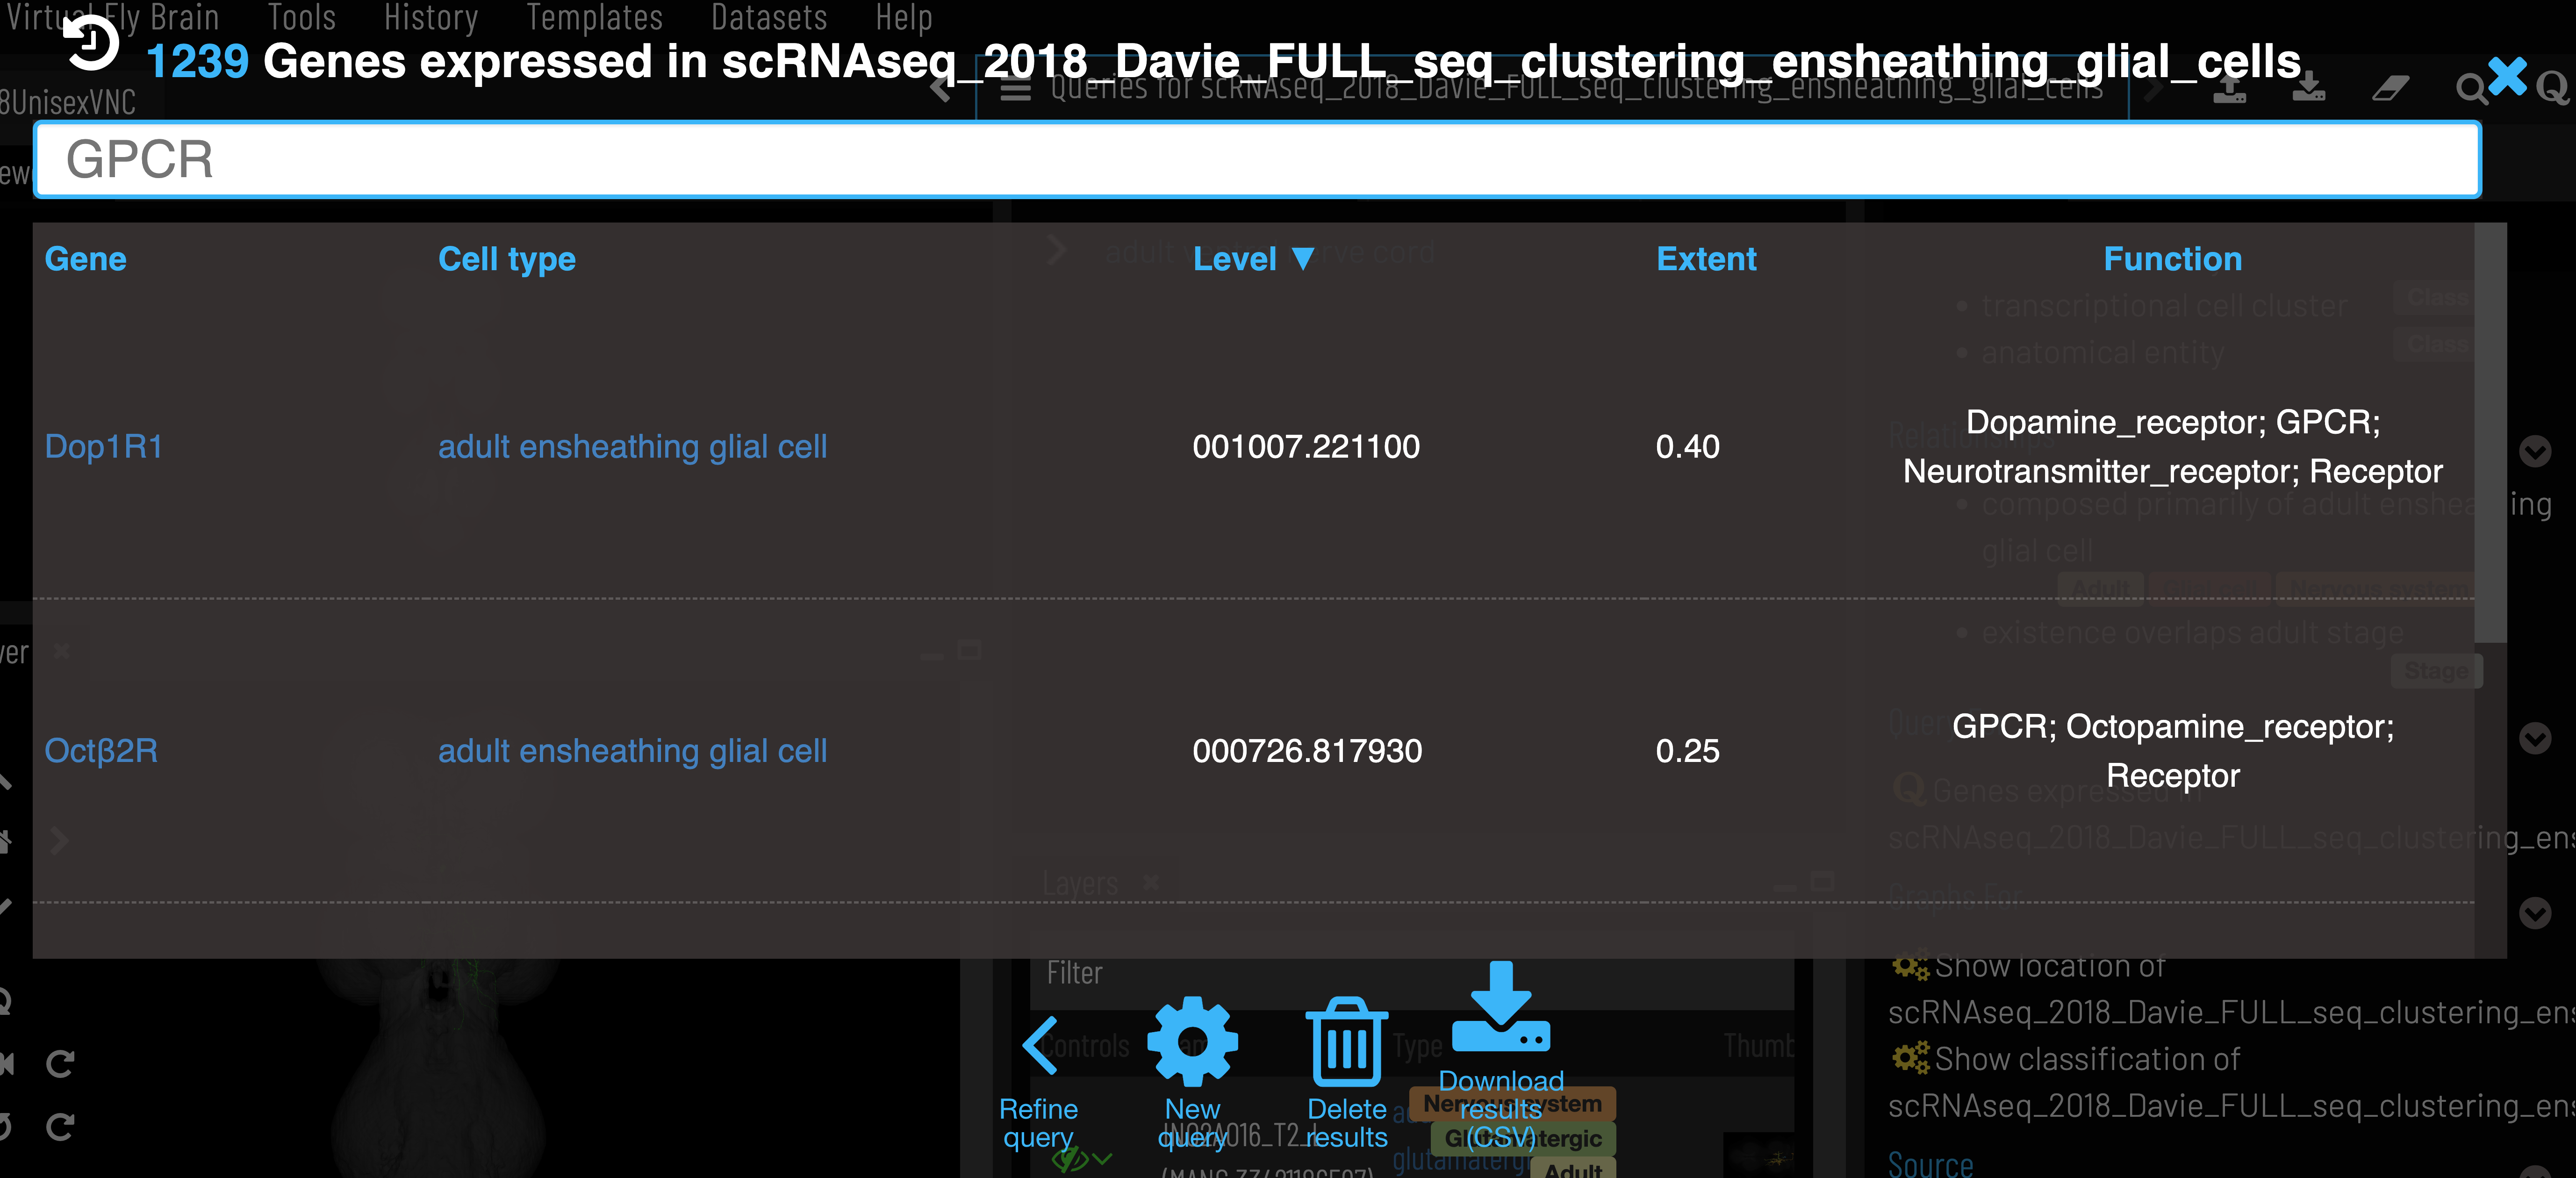
Expression level is the mean counts per million reads of all cells in the cell type cluster that express the given gene. Expression extent is the proportion of cells within the cluster that express the given gene. VFB only shows genes that are expressed in at least 20% of cells in the cluster (Extent > 0.2).
Samples, clusterings and stocks
A dataset’s ‘Clusterings in…’, ‘Samples in…’ and ‘Assays in…’ queries show how it was sequenced and analysed. Each Sample records its stage, tissue, sex and the stock, strain or genotype of the flies; each Assay links to its GEO, SRA and BioSample records. Cluster tables show the stages and tissues of the Samples behind each cluster. To find scRNAseq data from particular flies, open the stock, strain (e.g. a DGRP line or Canton-S) or allele and use ‘scRNAseq samples from…’ or ‘scRNAseq clusters from samples of…’. See the Queries Reference for every query and column.
Gene semantic tags
We add semantic tags to genes to allow quick searching and filtering of results (‘Function’ column of gene expression data). These tags are based on FlyBase Gene Group membership and GO annotations, which are all sourced from FlyBase. A full list of gene tags with their associated Gene group and GO terms can be found here.
API
Data can also be retrieved using VFB_connect.
Data sources and processing
- VFB curates each dataset in vfb-scRNAseq. The clusters are the authors’ own, with their cell-type annotations, taken from GEO, ArrayExpress, the paper or the authors’ published analysis. Samples record the stage, sex, tissue and the stock, strain or genotype. Where a study compares treatments or mutants, VFB uses the control samples.
- Each cluster is mapped to the Drosophila Anatomy Ontology term for the cell type it is composed primarily of. A cluster with no adequate term is held back rather than given a vague one, and is not shown in VFB.
- Summary expression is calculated per cluster from the authors’ count data (counts per million), and genes expressed in less than 20% of a cluster’s cells are left out. Gene ids are kept current with FlyBase.
Database schema
A simplified schema showing how scRNAseq data is stored in the VFB Neo4j database is shown below:
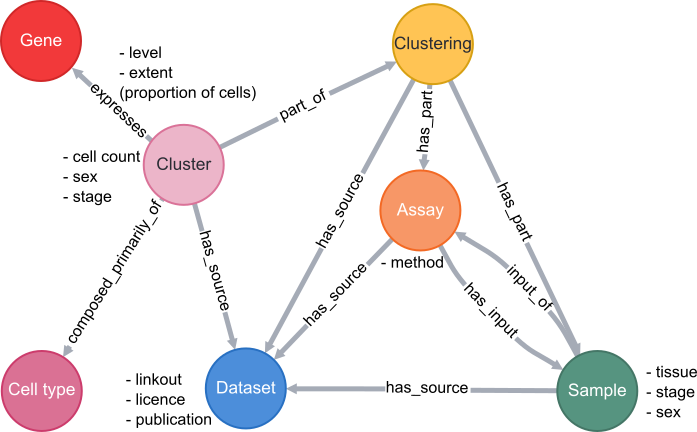
Cell types are classes from the Drosophila Anatomy Ontology and are also linked to several other types of data in VFB, such as images, connectomics and driver expression information.