Below are a few overview pages to help you get started using VFB:
This is the multi-page printable view of this section. Click here to print.
Getting Started
- 1: Starting to explore VFB
- 2: This is the Slice Viewer tab
- 3: This is the 3D Viewer tab
- 4: This is the Term Info tab
- 5: This is the Term Context tab
- 6: This is the Circuit Browser tab
- 7: How to Interpret VFB Thumbnails
- 8: Similarity Score Queries Guide
- 9: Bulk Image Download
- 10: Single cell RNAseq data
1 - Starting to explore VFB
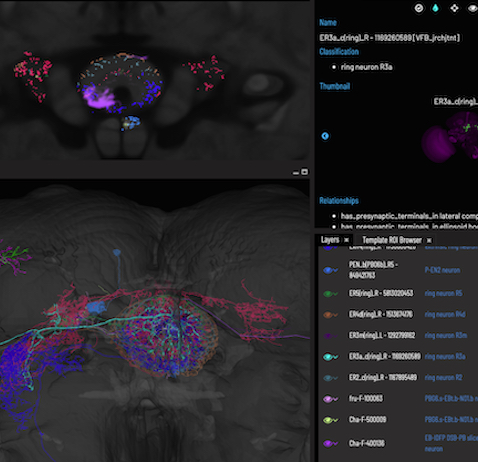
VFB integrates data curated from the literature with image data from many bulk sources. The search system allows you to search for neurons and neuroanatomical structures using almost any name found in the literature. The query system can identify neurons innervating any specified neuropil or fasciculating with any specified tract. It also allows queries for genes, transgenes and phenotypes expressed in any brain region or neuron. Search and query results combine referenced textual descriptions with 3D images and links to originating data sources. VFB features tens of thousands of 3D images of neurons, clones and expression patterns, registered to standard template brains. Any combination of these images can be viewed together. A BLAST-type query system (NBLAST) allows you to find similar neurons and drivers starting from a registered neuron.
Search for the item you’re interested in
Hover to explore brain regions in the Stack Viewer
Query for related terms and images
2 - This is the Slice Viewer tab
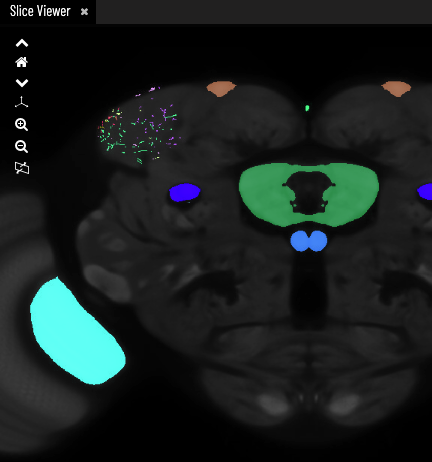
Hover to explore, click to list or shift + click to add painted anatomy
Use the arrow icons or scroll with the mouse to move through the stack
Home resets your view
Use the zoom icons or pinch gesture to zoom
Toggles through orthogonal views
Toggles the slice position on the 3D Viewer on/off
3 - This is the 3D Viewer tab
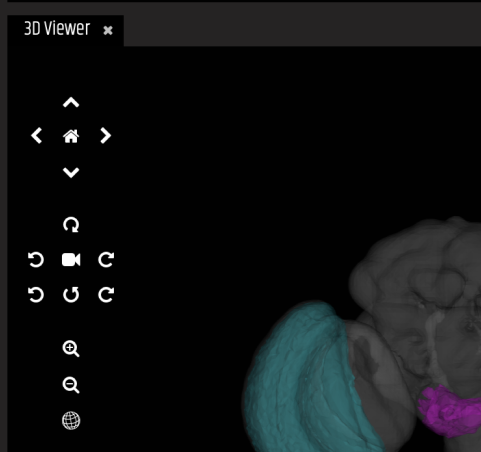
Point and click to select neurons/expression
Click and drag with the mouse or use the directional icons to rotate/move
Use the zoom icons or scroll with the mouse to zoom in/out
Home resets your view
The camera icon starts/stops a rotation animation of the scene
The sphere icon toggles wireframes on/off
4 - This is the Term Info tab
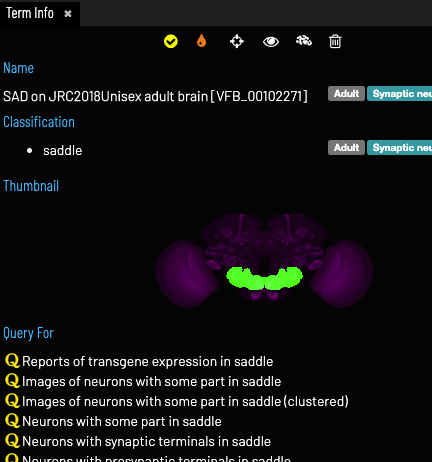
Click on thumbnails to add that image to the viewer
Click on terms to select them
Click on download items to begin downloading
Run term related queries
5 - This is the Term Context tab
Home resets your view
Use the zoom icons or scroll with the mouse to zoom in/out
Click to refresh to the current focus term
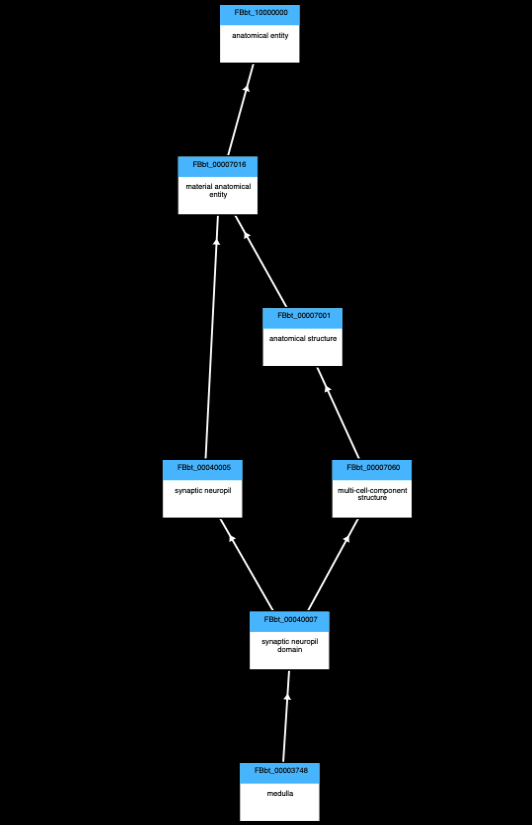
Select either the location or the classification for the current term
6 - This is the Circuit Browser tab
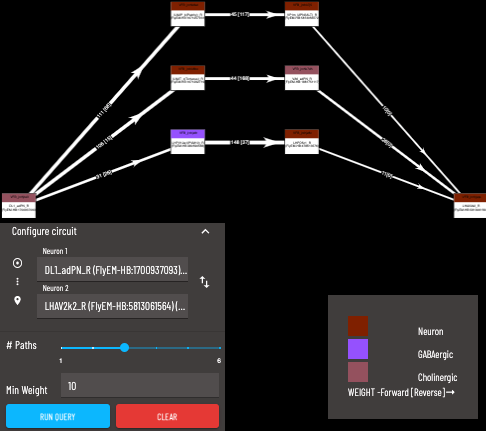
The ‘strongest’ paths are the shortest/highest weighted paths. Paths are arranged from the ‘strongest’ at the bottom to the ‘weakest’ at the top. A detailed explanation for the algorithm used to determine path strengths can be found here.
Search for the source neuron to start from (Note: query is directional)
Search for the target neuron
Maximum number of paths to return (only the ‘strongest’ paths will be returned)
A minimum weight for the synapse count of each connection can be applied, paths containing individual connections below this minimum will not be returned
7 - How to Interpret VFB Thumbnails
How to Interpret VFB Thumbnails
Here is a guide on how to interpret VFB thumbnails:
- Each pixel in a VFB thumbnail corresponds to a specific depth in the image stack.
- Brighter or more intense colors indicate higher intensity values at that depth.
- The color bar on the right side of the image provides additional context about the mapping between color and depth.
- Each color in the color bar corresponds to a specific depth in the image stack, and the intensity of the color represents the maximum intensity value at that depth.
- Users can use the color bar to identify the depth of the signal and gain insights into the distribution of intensity values across different depths in the image stack.

- Note the colour bar and hence the signal in the image uses nealy the whole of the available (Z) stack space.

- Note the colour bar and hence the signal in the image uses less of the available (Z) stack space.

- Note the colour bar and hence the signal in the image uses much less of the available (Z) stack space.
In summary, VFB thumbnails provide a simplified way to visualize complex 3D image data. Each pixel’s color and intensity represent the maximum intensity value at a specific depth, and the color bar provides additional context about the mapping between color and depth. By interpreting the colors and using the color bar, users can gain insights into the distribution of intensity values across the image stack.
8 - Similarity Score Queries Guide
Scores Availability
The similarity scores are calculated using NBLAST or other third-party scores (e.g. NeuronBridge). Only queries with above-threshold scores will appear in the ‘Find similar…’ menu.
Step 1: Select a Neuron or Expression Pattern
Navigate to the VFB browser and select a neuron or expression pattern of interest so it’s information is shown in the Term Info panel
Step 2: Open the ‘Find similar…’ Menu under the ‘Query For’ section
Under the ‘Query For’ section, locate the ‘Find similar…’ expandable menu. This menu will only appear if an above-threshold score is available for the selected neuron or expression pattern.
Step 3: Run a Similarity Score Query
Inside the ‘Find similar…’ menu, you will find queries to find morphologically similar neurons or expression patterns. Select a query to run it. The results will display neurons or expression patterns that are similar to your selected neuron or expression pattern.
Note: We recalculate these scores shortly after new data is added, so new matches may appear if you check back a few months later.
9 - Bulk Image Download
Using the Bulk Image Download Tool
Follow these steps to download multiple files from VirtualFlyBrain using the bulk download tool:
Step 1: Open the Images
Navigate to the VFB Browser and open all the images you are interested in downloading. You can do this by searching for specific images and opening their respective pages.
Step 2: Open the Bulk Download Tool
Once you have all the images open, locate the bulk download icon in the top right. Click on this icon to open the bulk download tool.
Step 3: Select the Data Type
In the bulk download tool, select the type of data you want to download. The options are OBJ, SWC, NRRD, and References.
Step 4: Select the Variables
If applicable, select specific variables related to the data type you have chosen.
Step 5: Download the Data
After making your selections, click the ‘Download’ button to start the download. The data will be downloaded in a zip file named “VFB Files.zip”.
Step 6: Unzip the File
Once the download is complete, locate the zip file in your downloads folder and unzip it to access the data.
Step 7: Open the Data
Finally, open the data in your chosen software. For example, if you chose OBJ, you could open the data in a 3D modeling program.
Note: If something goes wrong during the download, an error message will be displayed and you will be prompted to try again. If no entries are found for the selected types and variables, a message will be displayed to inform you.
10 - Single cell RNAseq data
Finding gene expression data on VFB
Finding cell type clusters
Cell types with available scRNAseq data can be identified using the ‘Has scRNAseq data filter’ when searching.
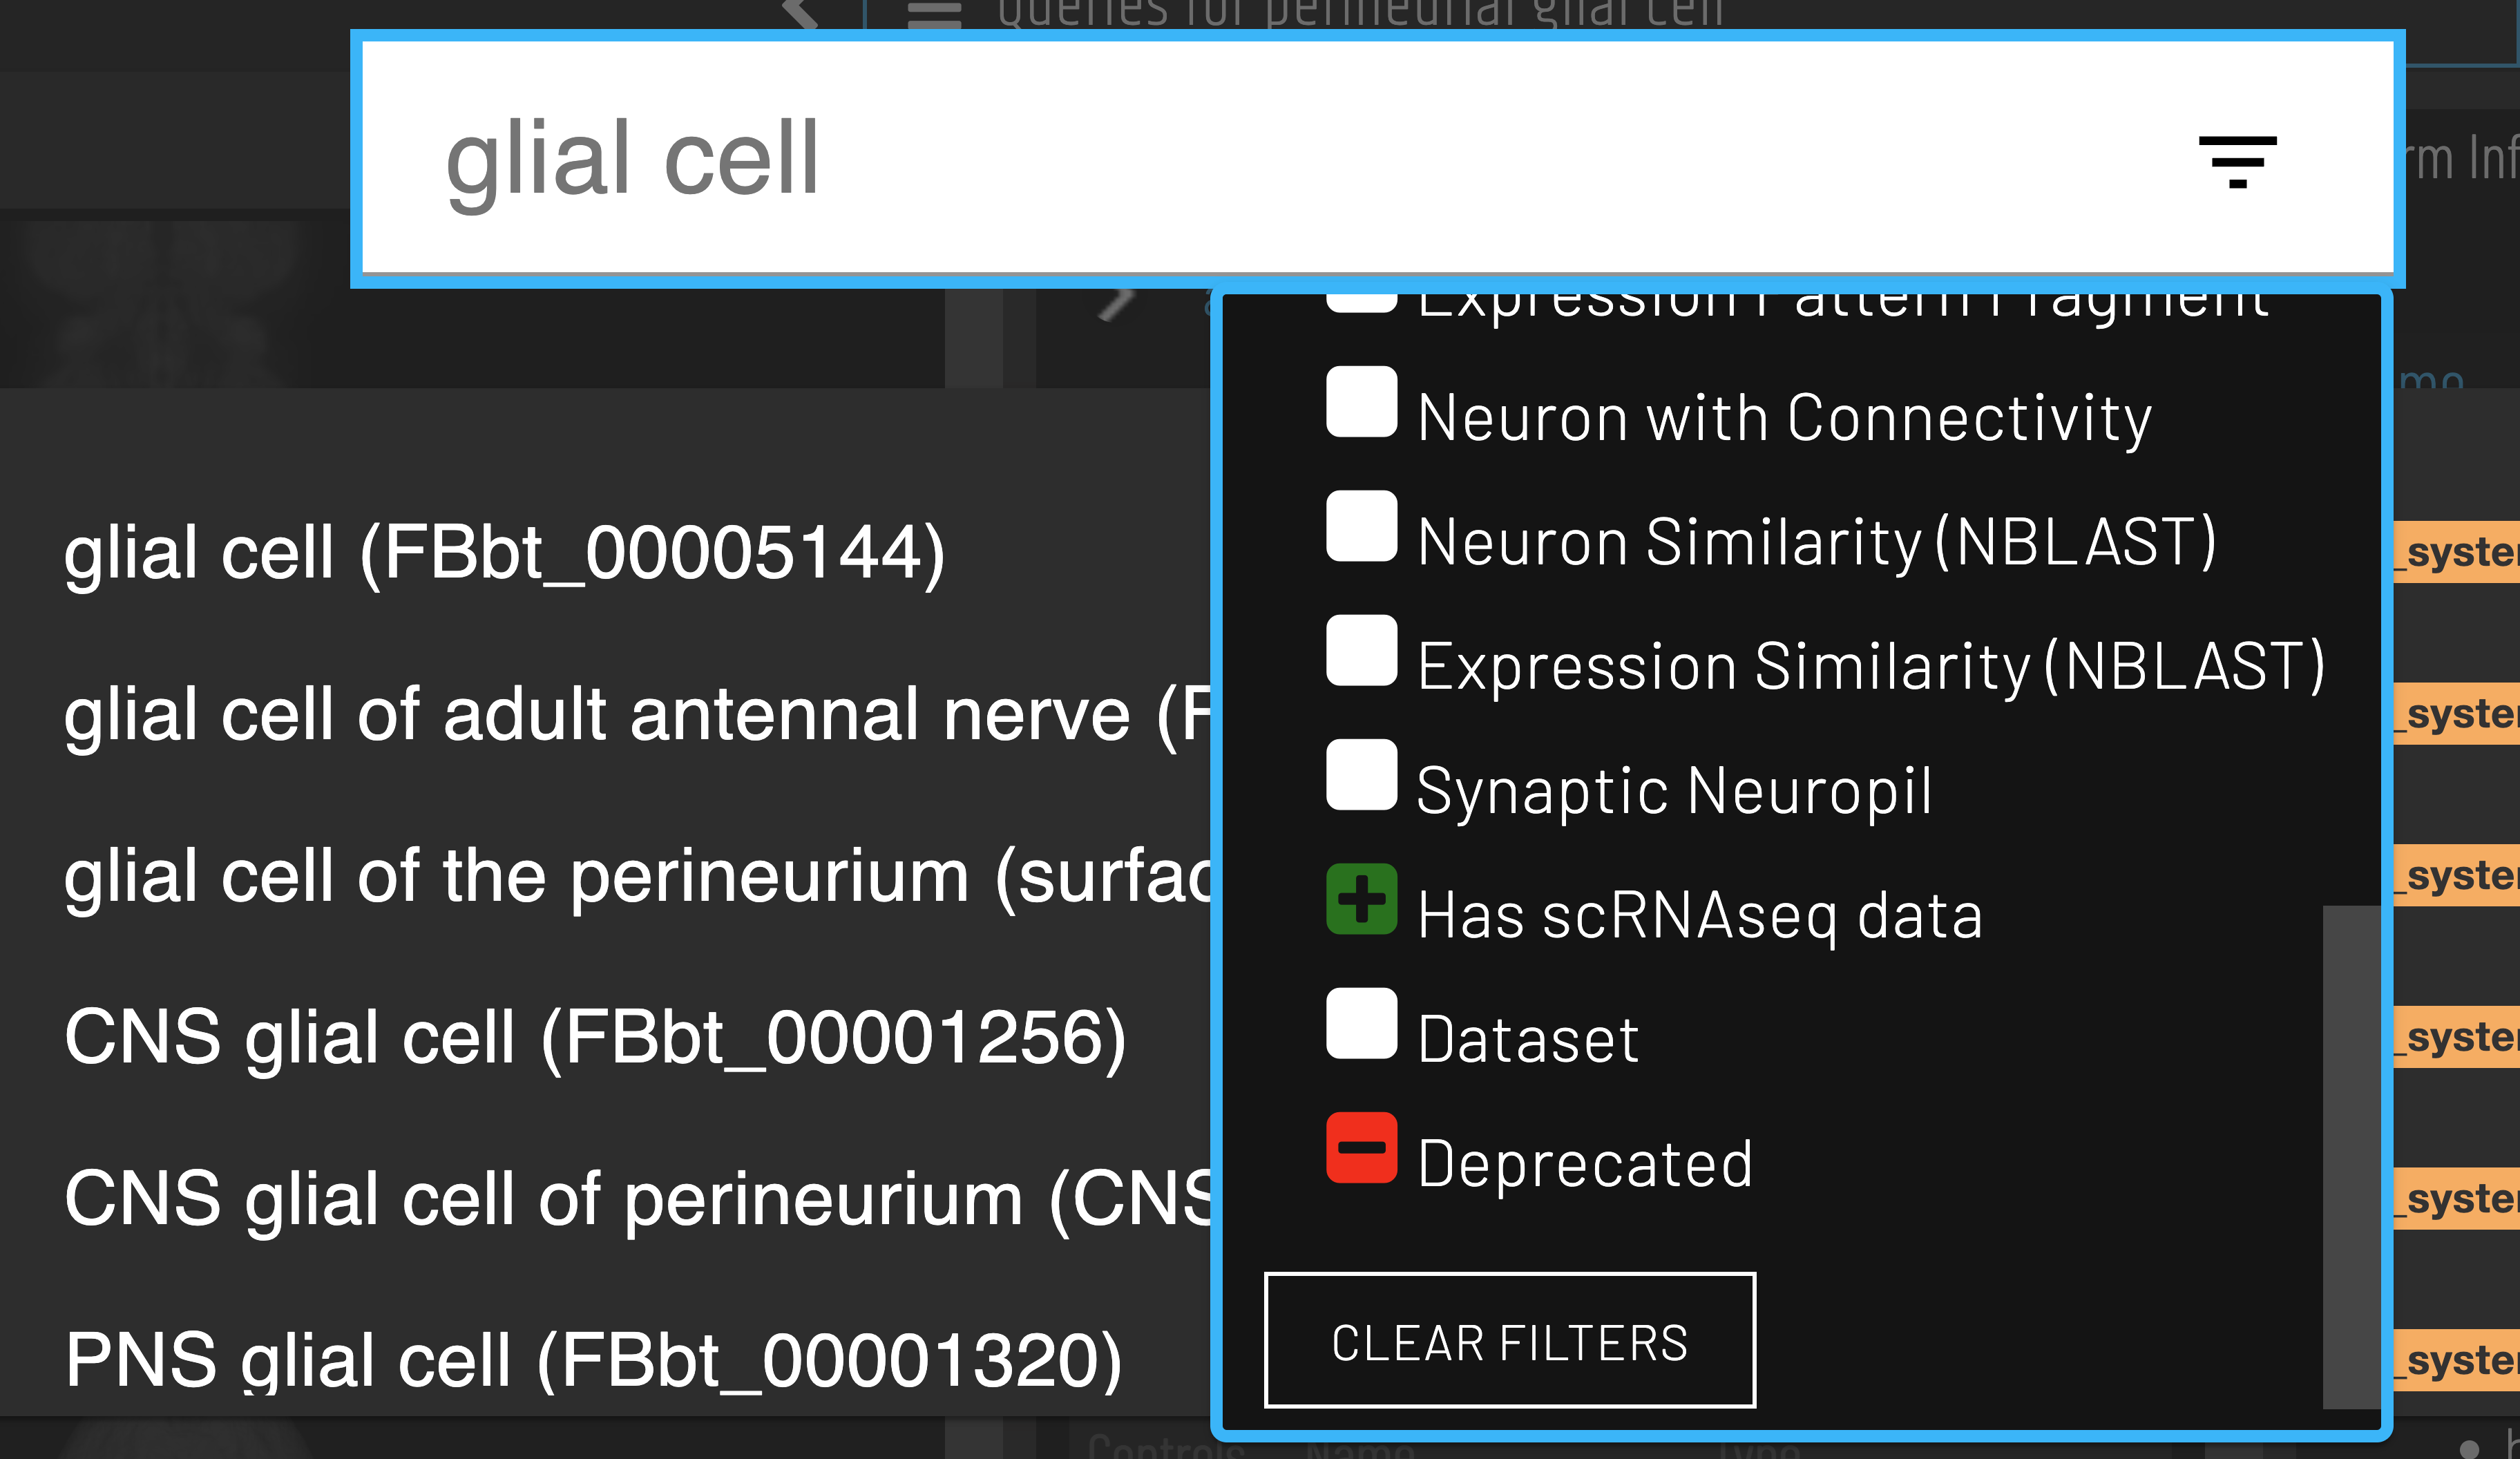
Clusters for a cell type of interest can be found via the ‘Single cell transcriptomics data for…’ query.

Gene expression data
After selecting a cluster, gene expression can be retrieved via the ‘Genes expressed in…’ query.
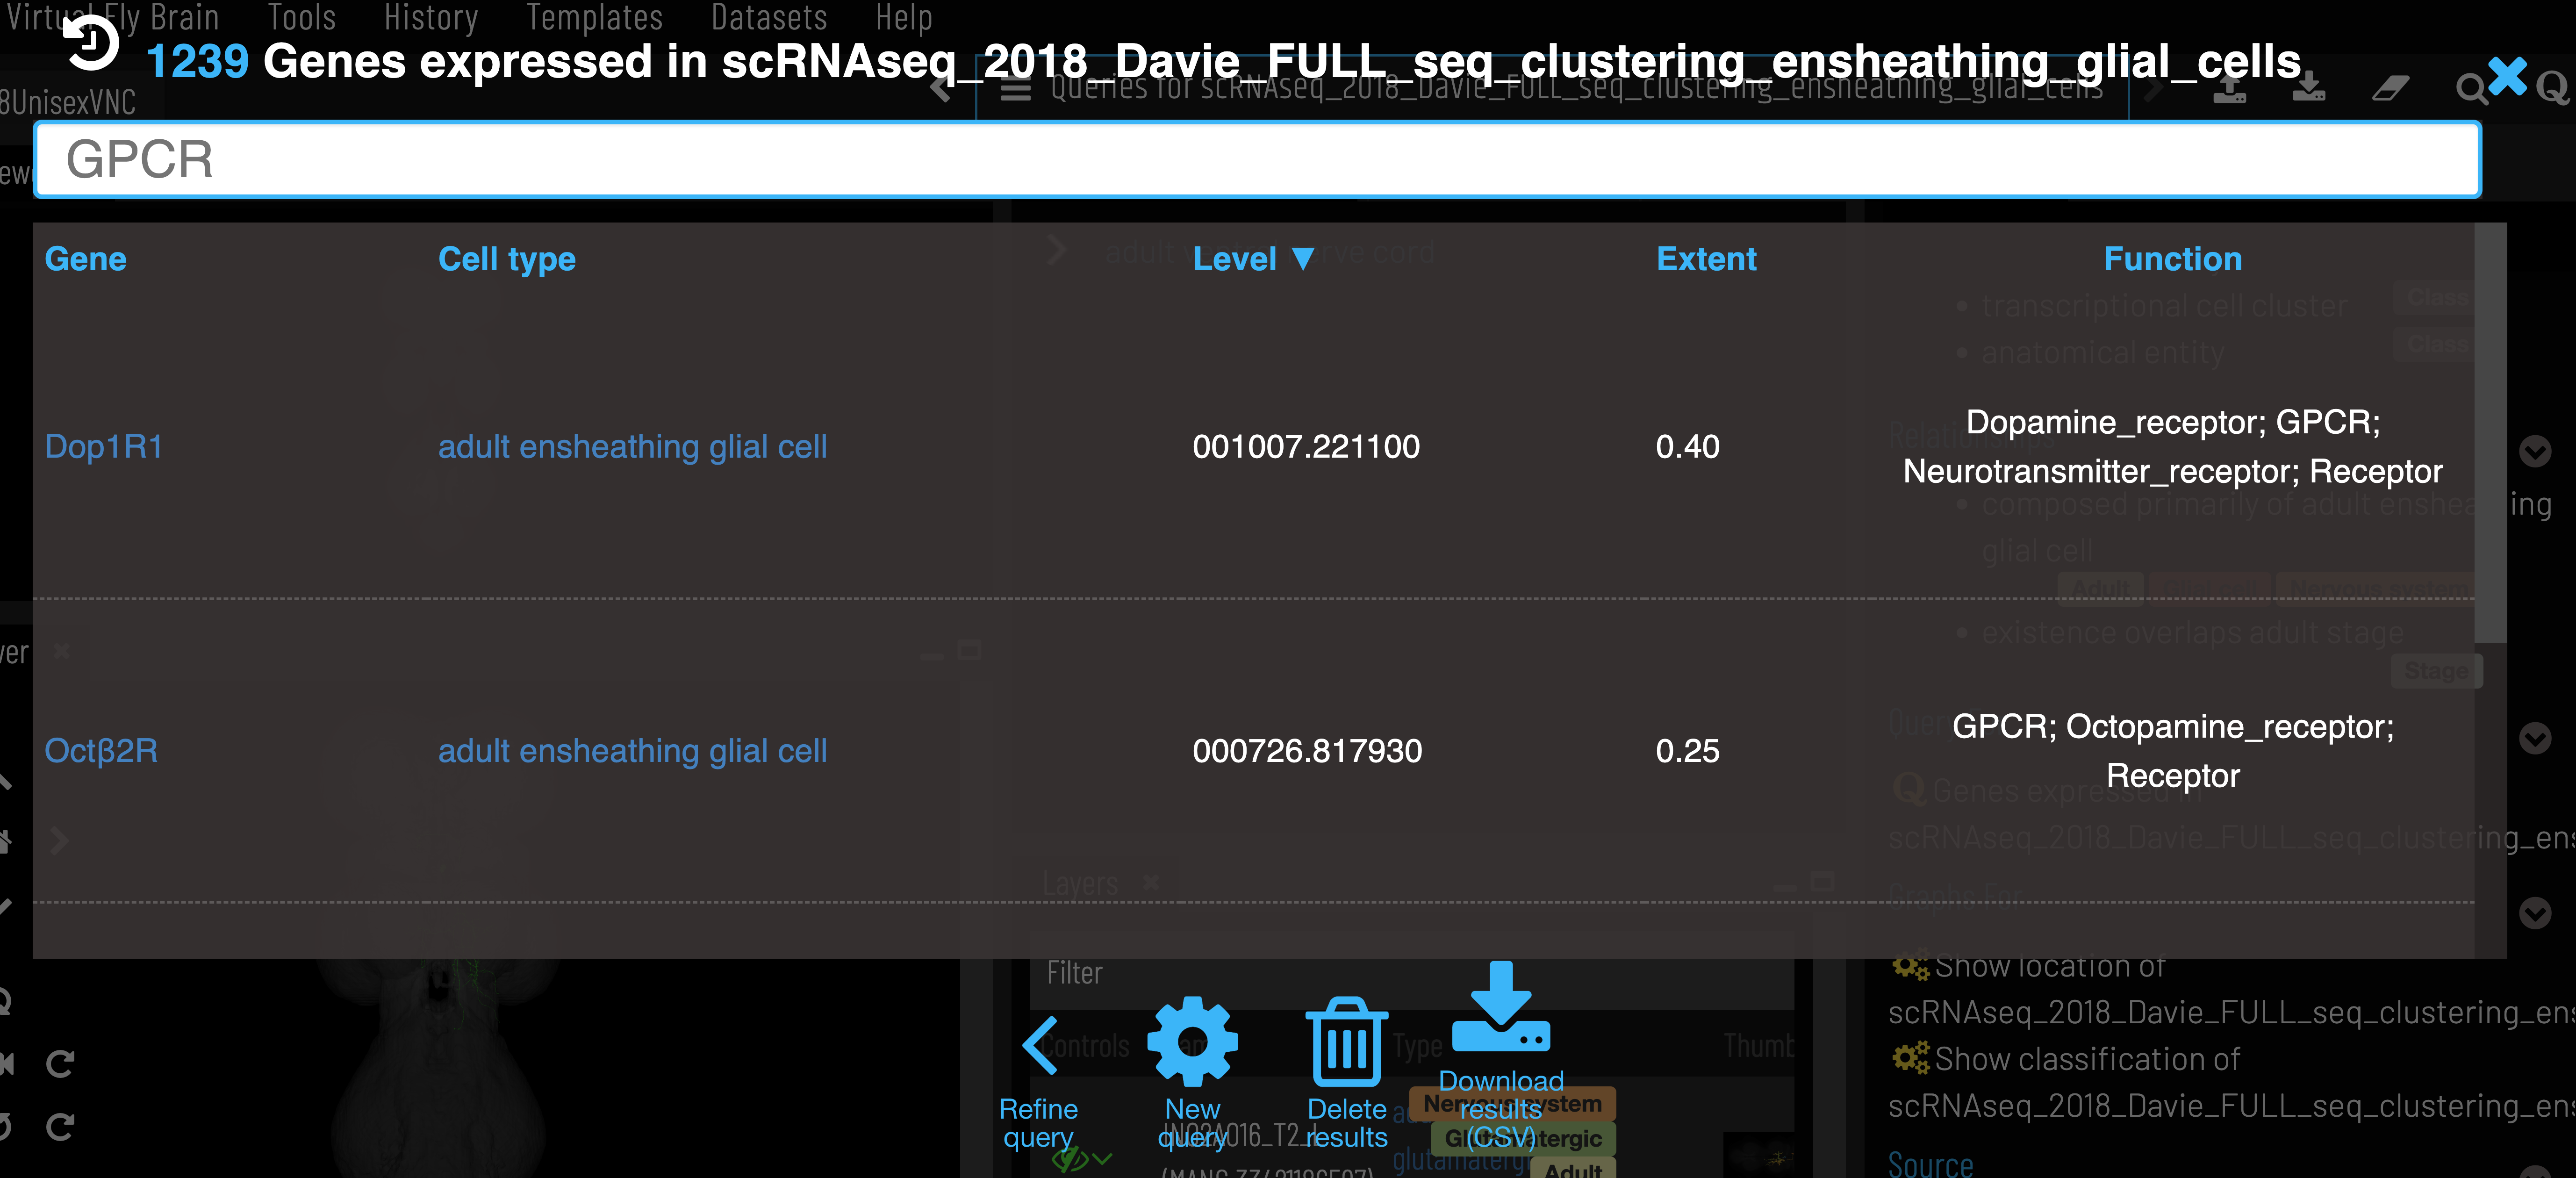
Expression level is the mean counts per million reads of all cells in the cell type cluster that express the given gene. Expression extent is the proportion of cells within the cluster that express the given gene. VFB only shows genes that are expressed in at least 20% of cells in the cluster (Extent > 0.2).
Gene semantic tags
We add semantic tags to genes to allow quick searching and filtering of results (‘Function’ column of gene expression data). These tags are based on FlyBase Gene Group membership and GO annotations, which are all sourced from FlyBase. A full list of gene tags with their associated Gene group and GO terms can be found here.
API
Data can also be retrieved using VFB_connect.
Data sources and processing
- Raw scRNAseq data is ingested by the EBI Single Cell Expression Atlas (SCEA). Where possible, cells are linked to cell types from the Drosophila Anatomy Ontology based on author annotations. Data is reprocessed, filtered and reclustered.
- FlyBase takes data from EBI, keeping only cells that are linked to ontology terms and generating summary expression data for each cell type (cluster).
- VFB takes control/wild type expression data from FlyBase for datasets where at least one nervous system cell type is present and filter out any genes expressed in less than 20% of cells per cluster.
Database schema
A simplified schema showing how scRNAseq data is stored in the VFB Neo4j database is shown below:
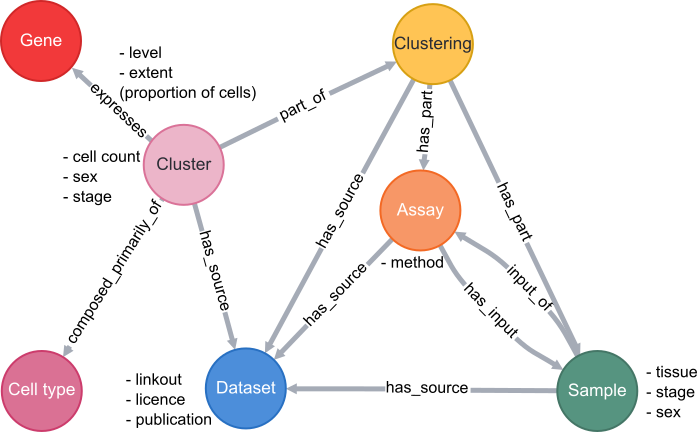
Cell types are classes from the Drosophila Anatomy Ontology and are also linked to several other types of data in VFB, such as images, connectomics and driver expression information.